

Analytics Overview
The Overview tab gives you a quick summary of your mobile app’s performance during a selected reporting period.
Overview
The Overview tab provides a high-level summary of your mobile app's performance within the selected time period. It helps you track revenue, user behavior, conversion metrics, and engagement to support business decisions.
You can:
Select a reporting period.
Compare the selected period with a previous period.
Monitor performance trends across all available metrics.
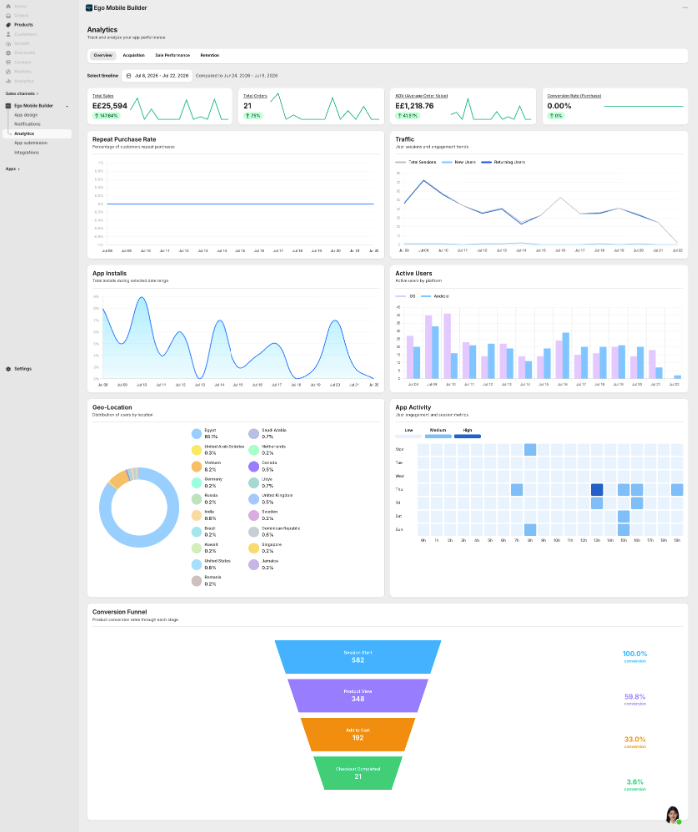
Total Sales
Purpose
Track the total revenue generated from orders placed through your mobile app.
Use case
Evaluate your app's sales performance.
Identify peak sales periods.
Measure the impact of marketing campaigns or promotions.
Recommended actions
Compare sales performance against your business targets.
Investigate unexpected increases or decreases.
Review Traffic and Conversion Rate together to better understand changes in revenue.
Total Orders
Purpose
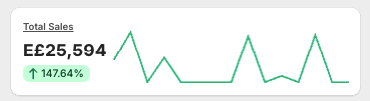
Track the total number of completed orders placed through your mobile app.
How to read
Displays the total number of completed orders within the selected time period.
Includes all successfully completed orders generated through the mobile app.
The sparkline chart shows the order trend over time.
Use case
Measure overall order volume.
Compare with Total Sales to understand purchasing performance.
Recommended actions
Monitor order volume after marketing campaigns.
If Total Sales decreases while Total Orders remain stable, review the Average Order Value (AOV).
AOV (Average Order Value)
Purpose
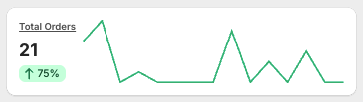
Track the average amount customers spend per order.
How to read
Displays the average value of each completed order during the selected time period.
Use case
Evaluate the effectiveness of upselling and cross-selling strategies.
Measure the impact of Bundle offers, Cart Upsell, or Free Gift campaigns.
Recommended actions
Introduce Bundle or Upsell offers if the AOV is low.
Monitor AOV after launching promotions or discount campaigns.
Conversion Rate (Purchase)
Purpose
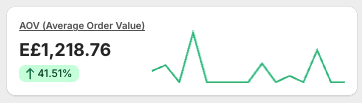
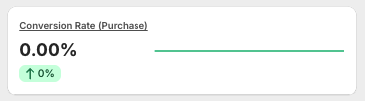
Measure the percentage of users who complete a purchase after visiting your app.
How to read
Displays the percentage of users who successfully complete a purchase.
A higher conversion rate generally indicates a more effective shopping experience.
Use case
Evaluate the overall effectiveness of the customer purchase journey.
Measure the impact of UI/UX improvements or marketing campaigns.
Recommended actions
Review the Conversion Funnel if the conversion rate is low.
Optimize the product page or checkout experience.
Reduce unnecessary steps during the purchase process.
Repeat Purchase Rate
Purpose
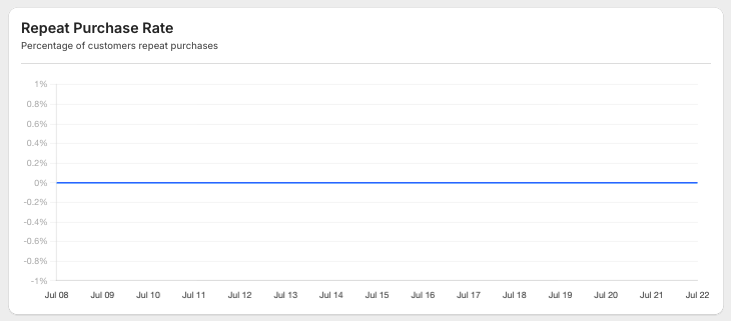
Measure the percentage of customers who make more than one purchase.
How to read
The chart displays the trend of repeat purchase rates over the selected time period.
Use case
Evaluate customer loyalty.
Measure the effectiveness of Loyalty Programs or Push Notifications.
Recommended actions
Launch customer loyalty programs.
Send push notifications to existing customers.
Offer exclusive discounts to encourage repeat purchases.
Traffic
Purpose
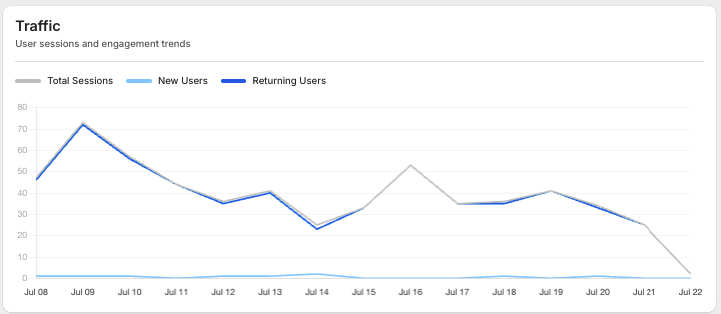
Track visitor activity within your mobile app.
Metrics
Total Sessions
New Users
Returning Users
How to read
The chart displays traffic trends for new and returning users during the selected time period.
Use case
Measure user acquisition performance.
Monitor customer retention over time.
Recommended actions
Increase marketing efforts if New Users are declining.
Improve user engagement if Returning Users are decreasing.
App Installs
Purpose
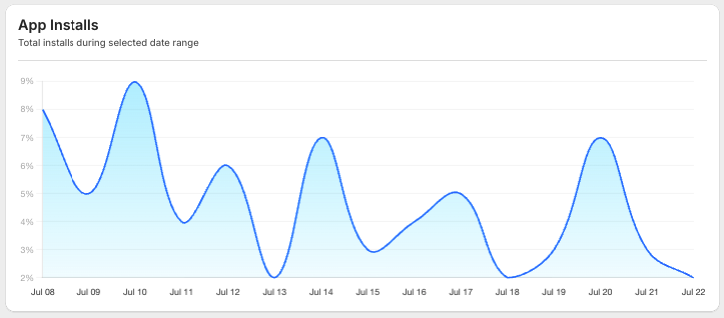
Track the number of new app installations.
How to read
The chart displays daily app installs during the selected reporting period.
Use case
Evaluate the effectiveness of app promotion campaigns.
Monitor user growth over time.
Recommended actions
Compare App Installs with Traffic to evaluate acquisition performance.
Measure the effectiveness of App Store Optimization (ASO) or advertising campaigns.
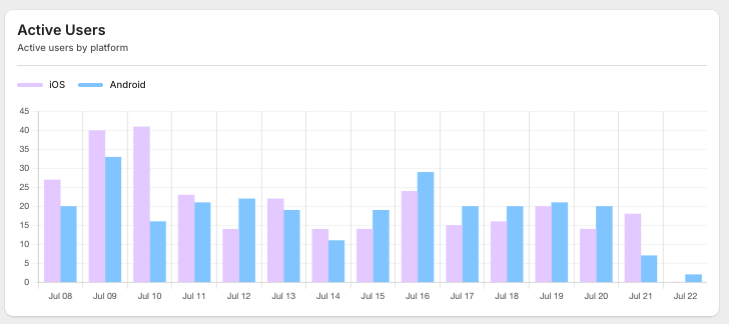
Active Users
Purpose
Track the number of users actively using your mobile app.
Metrics
iOS Users
Android Users
How to read
The bar chart displays the number of active users on each platform during the selected time period.
Use case
Compare user activity between iOS and Android.
Monitor platform usage trends.
Recommended actions
Investigate platform-specific issues if active users decrease unexpectedly.
Prioritize improvements for the platform with the largest active user base.
Geo-Location
Purpose
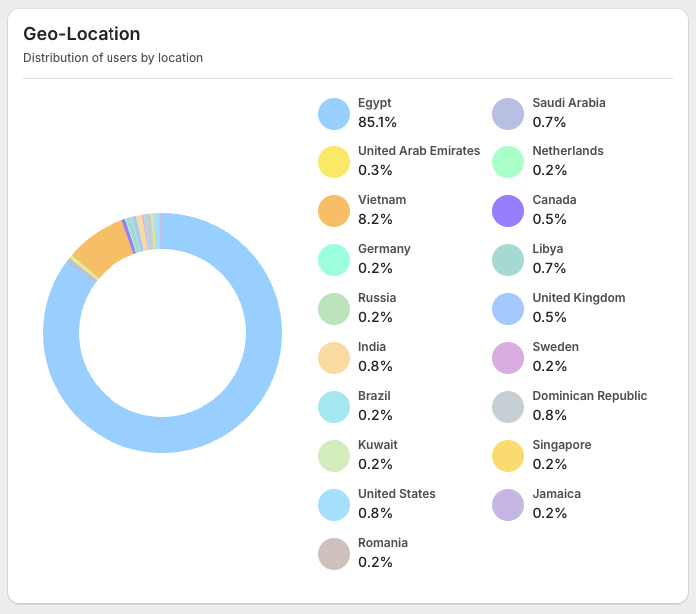
Analyze the geographic distribution of your app users.
How to read
The donut chart displays the percentage of users by country or region.
Use case
Identify key markets.
Analyze where your users are located.
Recommended actions
Localize content for different regions.
Launch region-specific marketing campaigns.
Customize promotions based on user location.
App Activity
Purpose
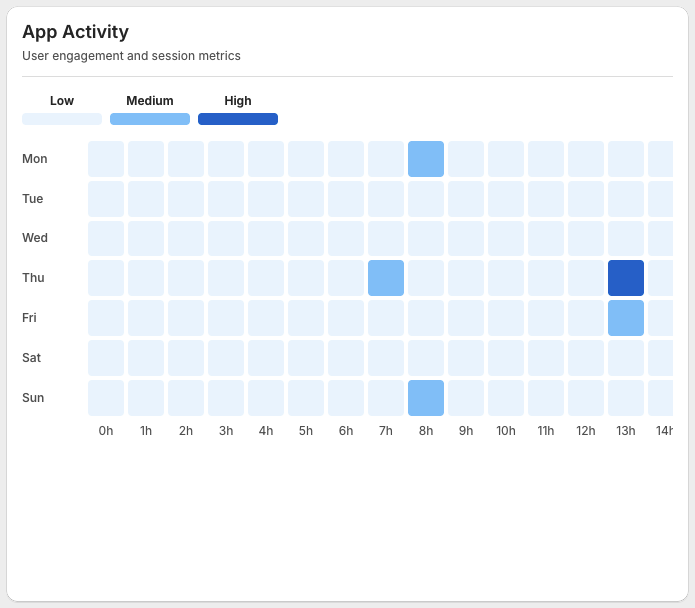
Track when users are most active in your mobile app.
How to read
The heatmap displays user activity based on:
Day of the week
Hour of the day
Darker colors indicate higher levels of user activity.
Use case
Identify peak engagement times.
Determine the best time to send Push Notifications.
Recommended actions
Schedule Push Notifications during peak activity hours.
Launch Flash Sales or live events when user activity is highest.
Conversion Funnel
Purpose
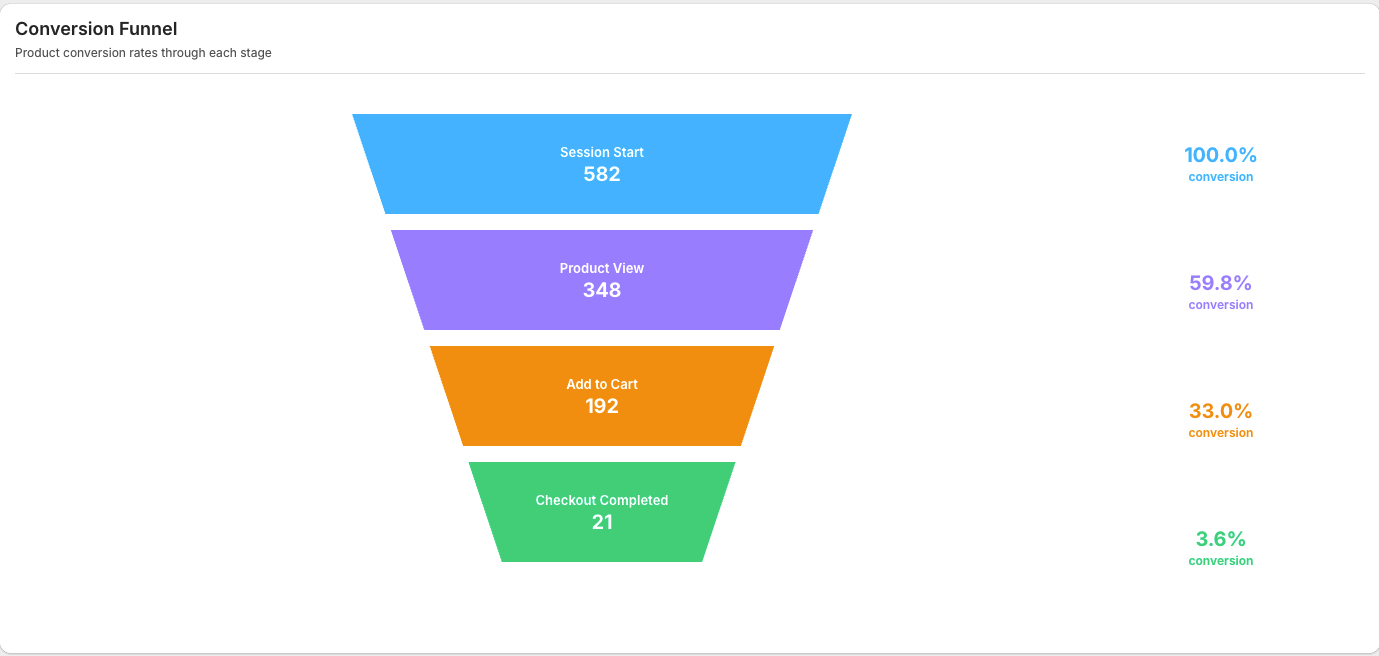
Visualize user conversion throughout the shopping journey.
Funnel stages
Session Start
Product View
Add to Cart
Checkout Completed
How to read
Each stage represents the number of users who remain in the purchase journey. The conversion rate between stages helps identify where users drop off.
Use case
Analyze the customer purchase journey.
Identify the stage with the highest drop-off rate.
Recommended actions
If users drop off after Product View, improve product images, descriptions, pricing, or product information.
If users drop off after Add to Cart, review shipping costs, promotions, or checkout incentives.
If users drop off during Checkout, simplify the checkout flow and provide more payment options.
Monitor the funnel after UI updates or marketing campaigns to measure optimization results.
Frequently Asked Questions
1. What can I monitor from the Analytics Overview?
You can monitor key mobile app metrics including sales, orders, AOV, conversion rate, repeat purchases, traffic, installs, active users, user locations, app activity, and the conversion funnel.
2. Can I compare performance between different periods?
Yes. You can select a reporting period and compare its performance with the previous period to identify changes and trends.
3. Do Total Sales and Total Orders include purchases from my online store?
No. These metrics track completed orders and revenue generated through your mobile app.
4. How can I identify where customers drop off during the purchase journey?
Use the Conversion Funnel to compare users across Session Start, Product View, Add to Cart, and Checkout Completed and identify the stage with the highest drop-off.
Still need help?
Our support team is available 24/7. Contact support →