

Performance Analytics
Analyze your store's conversion performance from Facebook and TikTok with funnel metrics, tag analytics, and product insights.
Overview
Performance Analytics helps you measure customer behavior and evaluate your store's sales performance.
From this guide, you will:
Switch between Facebook Pixel and TikTok Pixel data.
Filter analytics by a selected date range.
Track conversion performance across the customer journey.
Analyze product tag performance and revenue.
Identify top-performing products based on key metrics.
Platform
At the top right of the page, click the platform dropdown and select Facebook Pixel or TikTok Pixel.
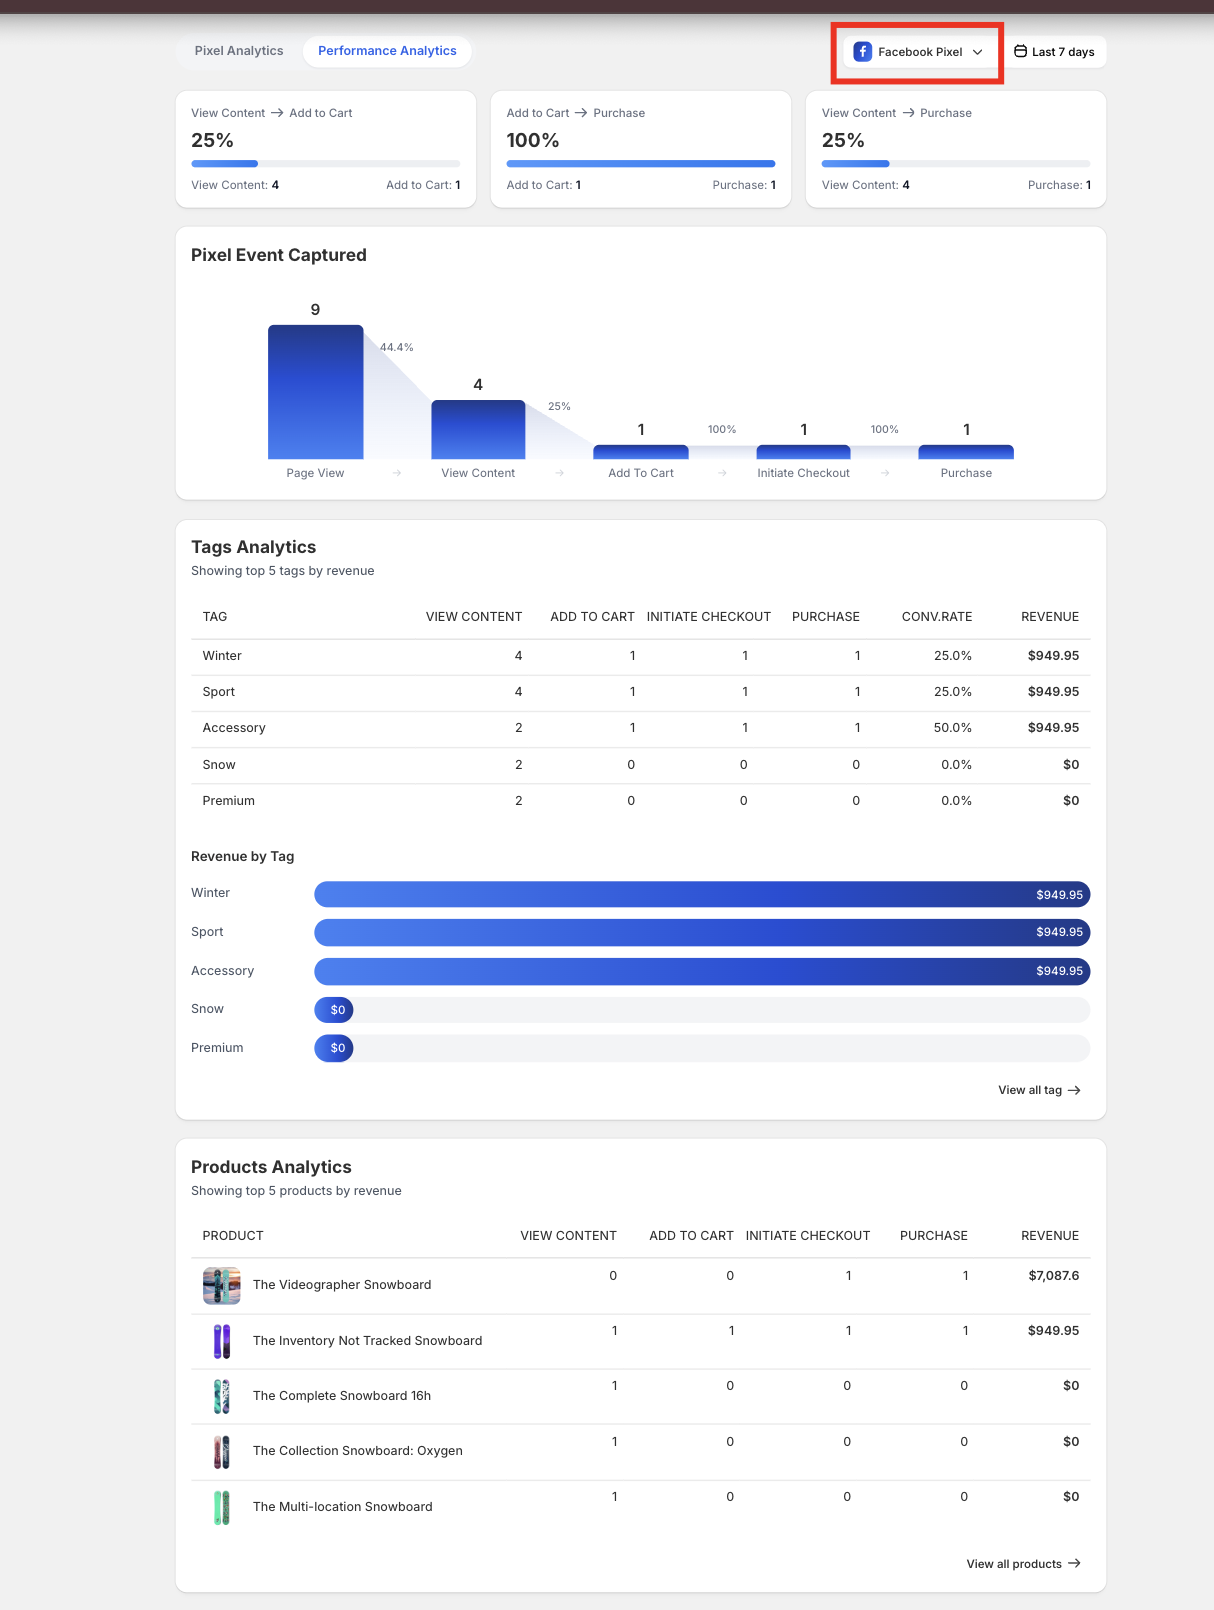
=> All data in this page will update based on the selected platform.
Tip: Keep the same date range and switch between Facebook Pixel and TikTok Pixel to compare how each channel performs.
Date Range
Select a date range to view analytics within a specific period (e.g., Last 7 days).
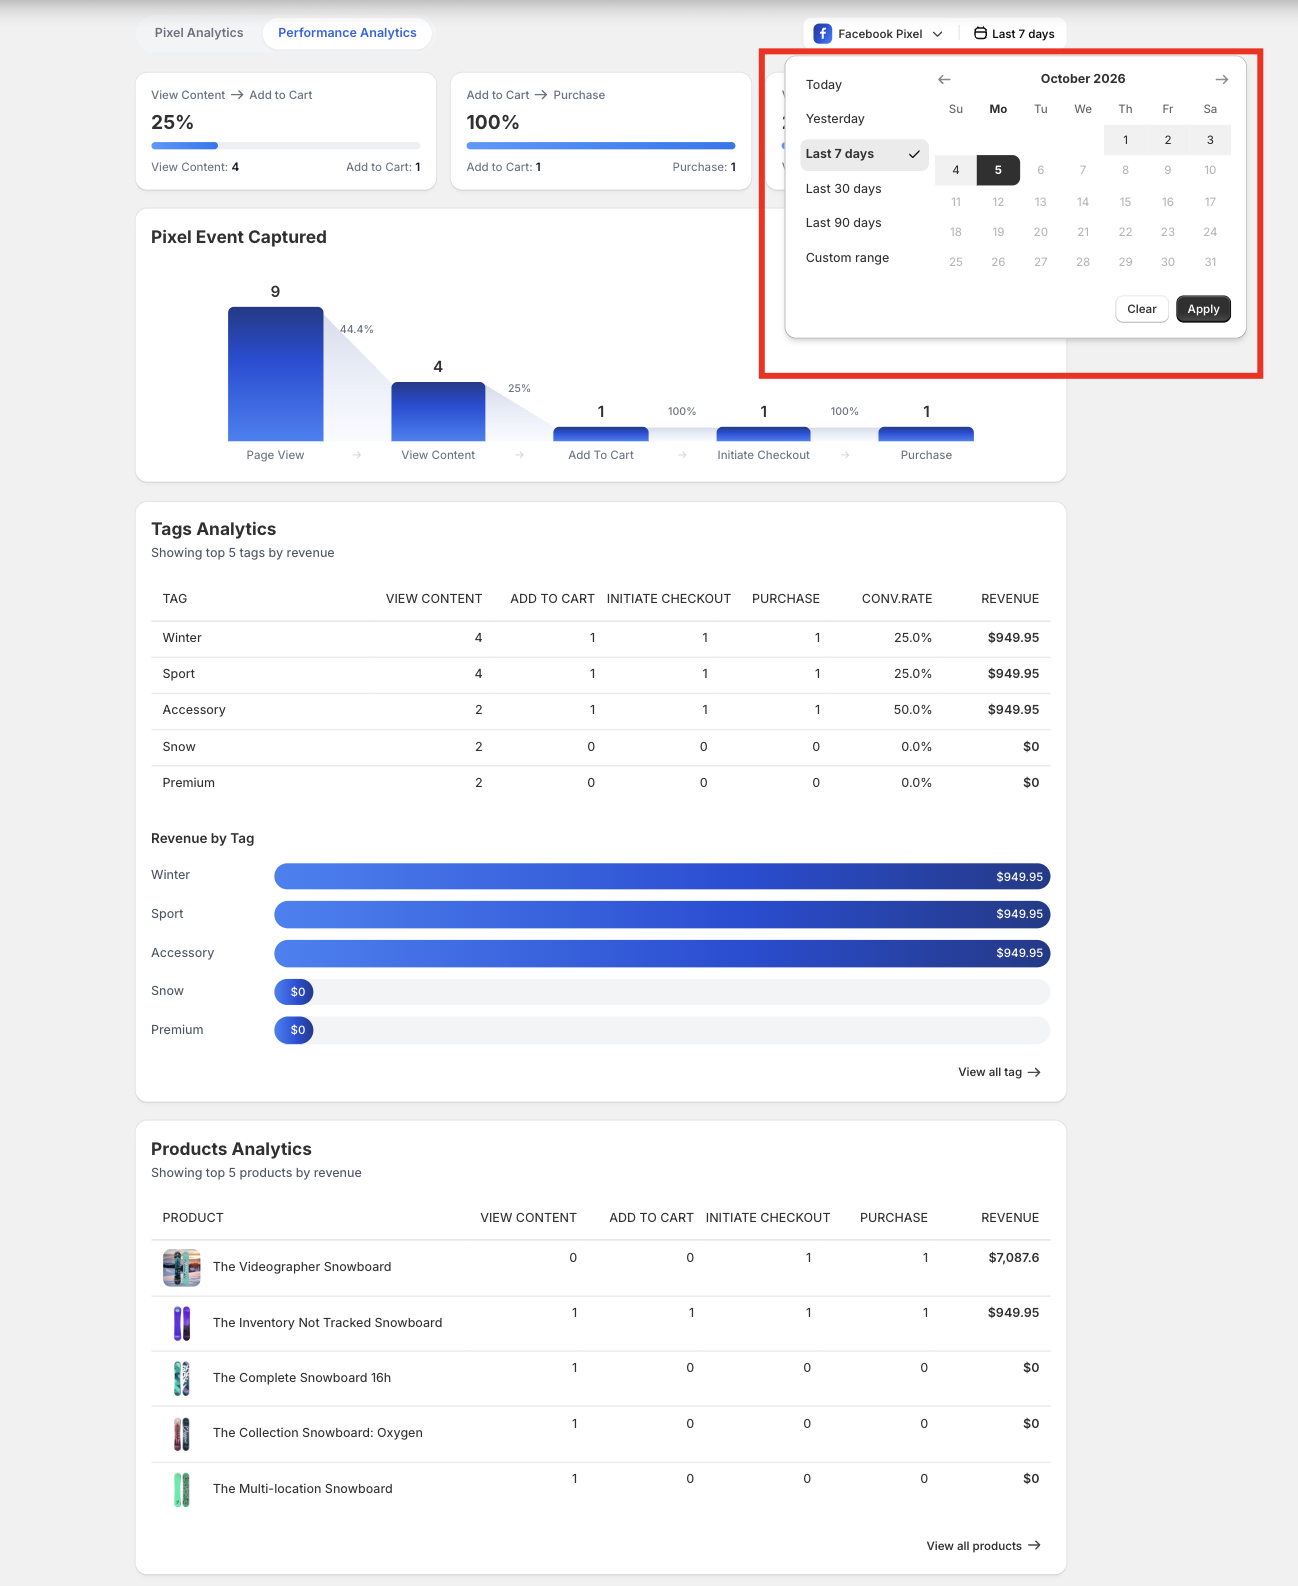
=> All data in this page will update based on the selected timeframe.
Funnel Conversion Metrics
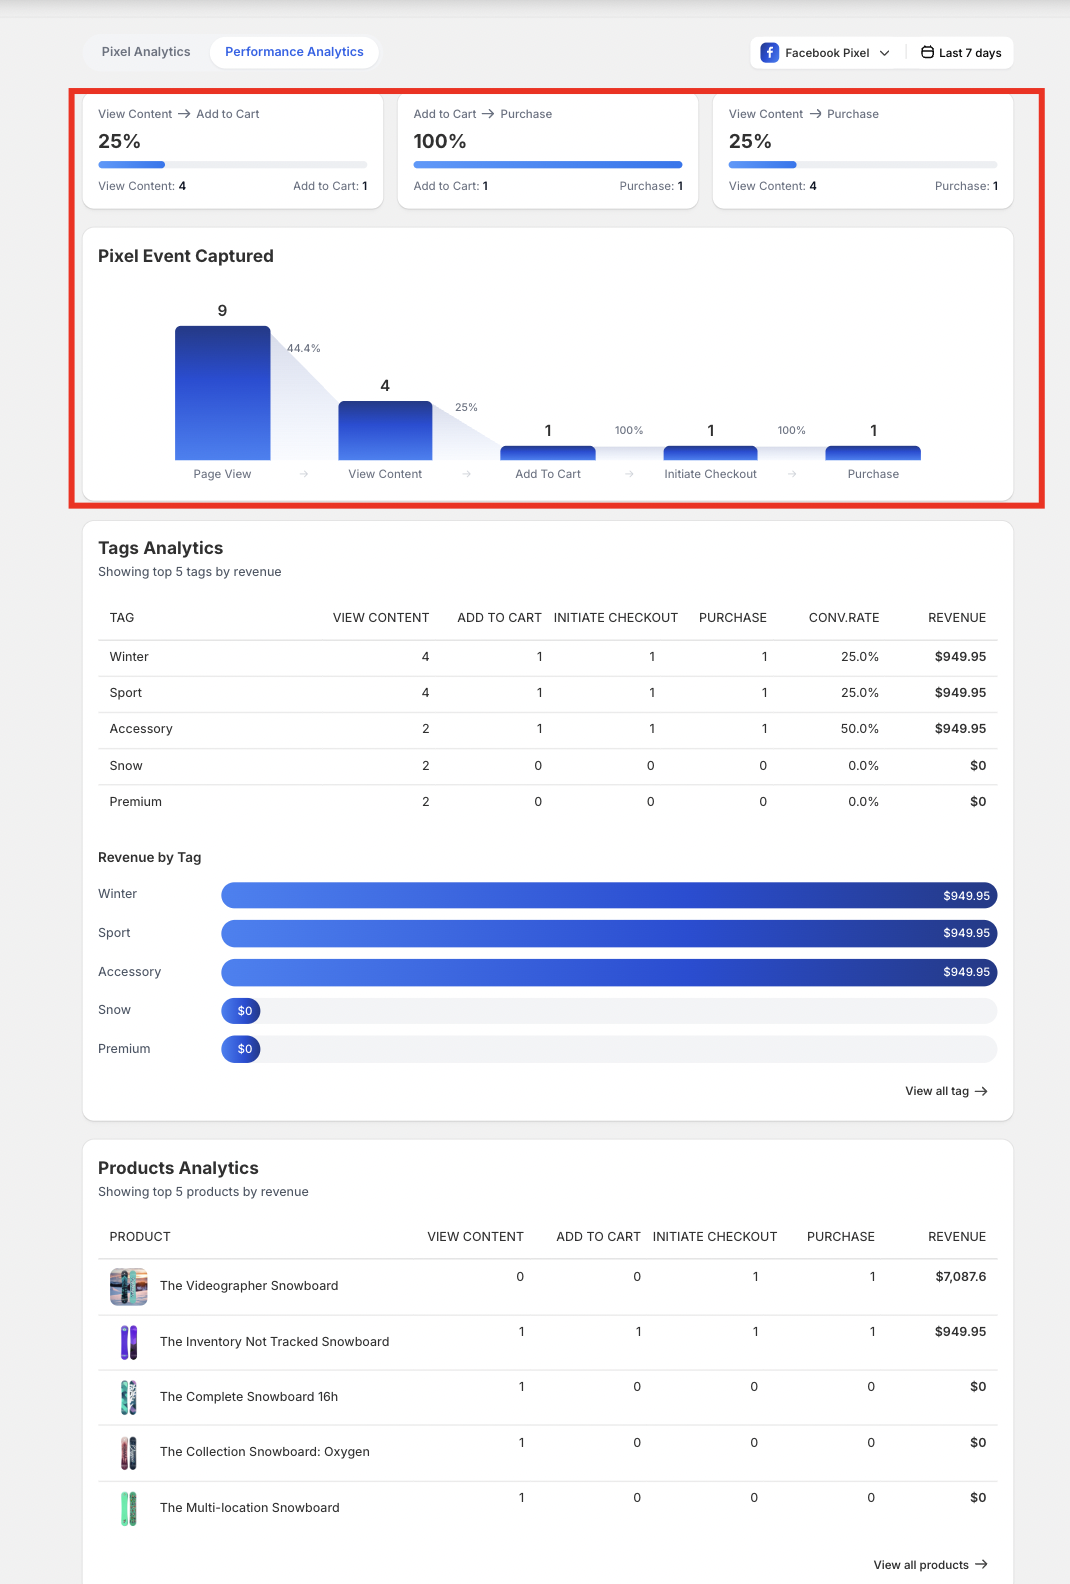
These metrics show how customers move through the shopping journey.
View Content → Add to Cart: Number of customers who added a product to cart after viewing it.
Add to Cart → Purchase: Shows how many users completed a purchase after adding items to the cart.
View Content → Purchase: Shows the overall product page to purchase conversion rate.
Tags Analytics
This section analyzes performance based on Shopify product tags.
Metrics explained:
View Content - Number of product page views for products with that tag.
Add to Cart - Number of times products with that tag were added to cart.
Initiate Checkout - Number of checkout events for products with that tag.
Purchase - Number of successful purchases.
Conv. Rate - Conversion rate from View Content → Purchase.
Revenue: Total revenue generated by products with that tag.
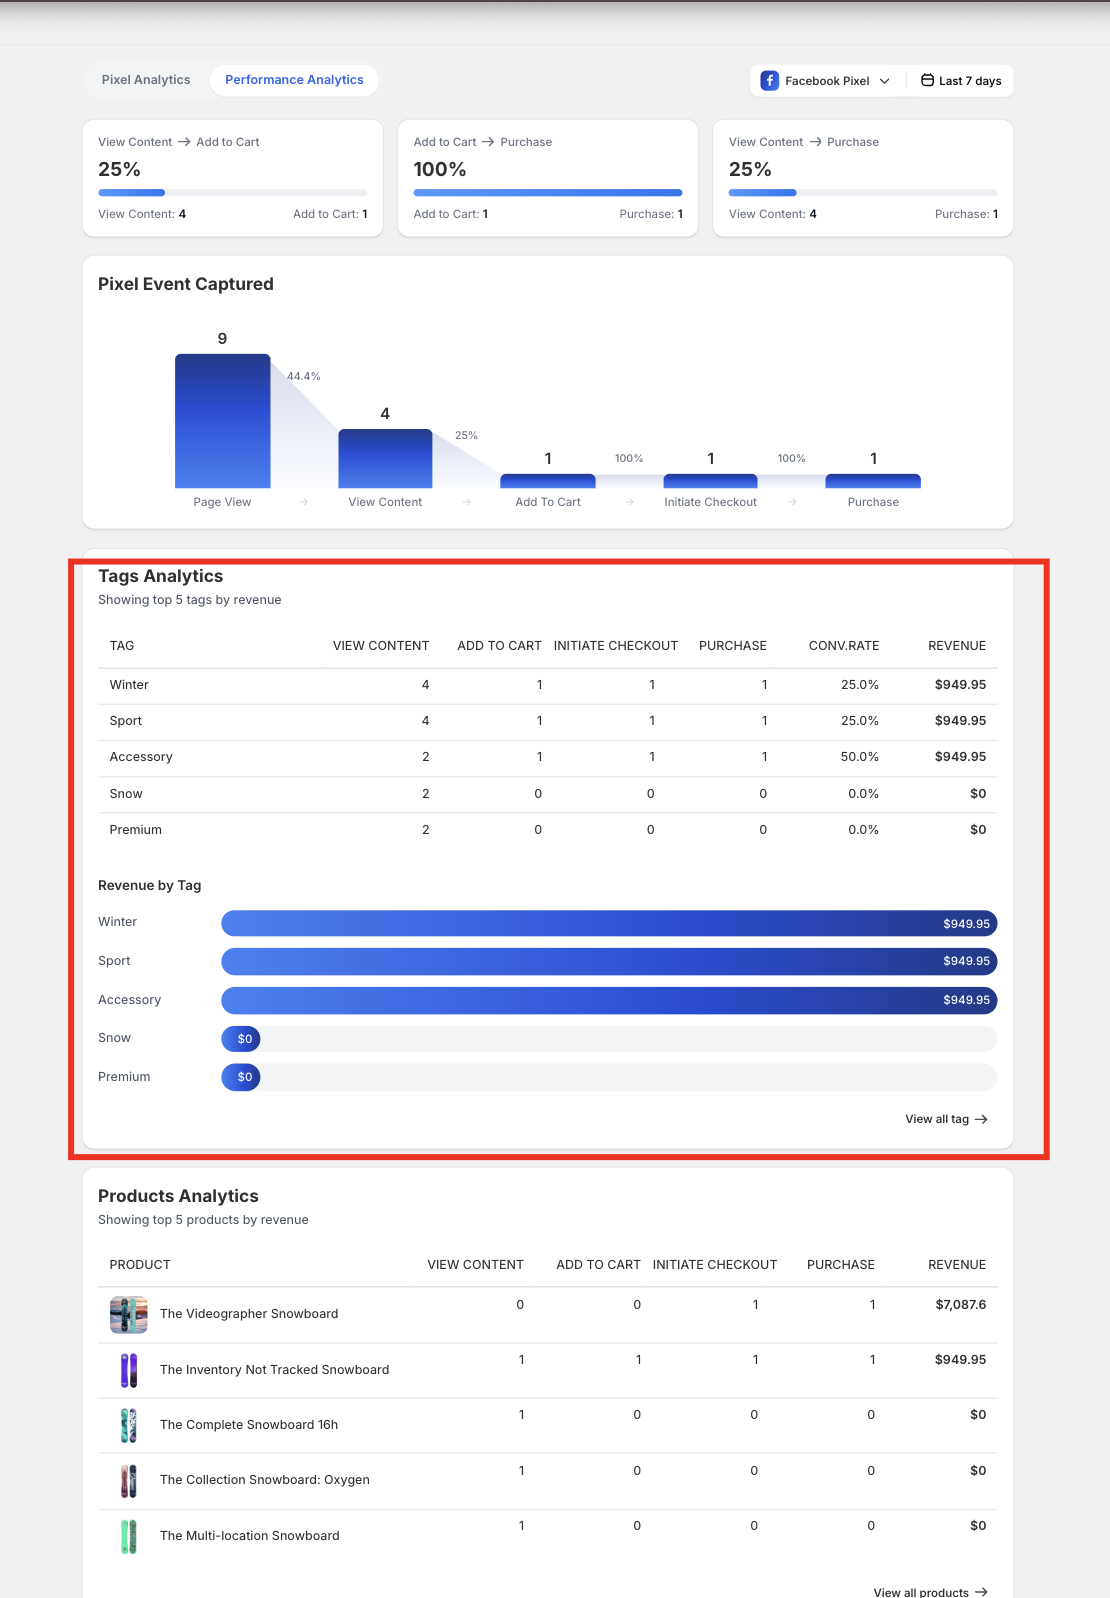
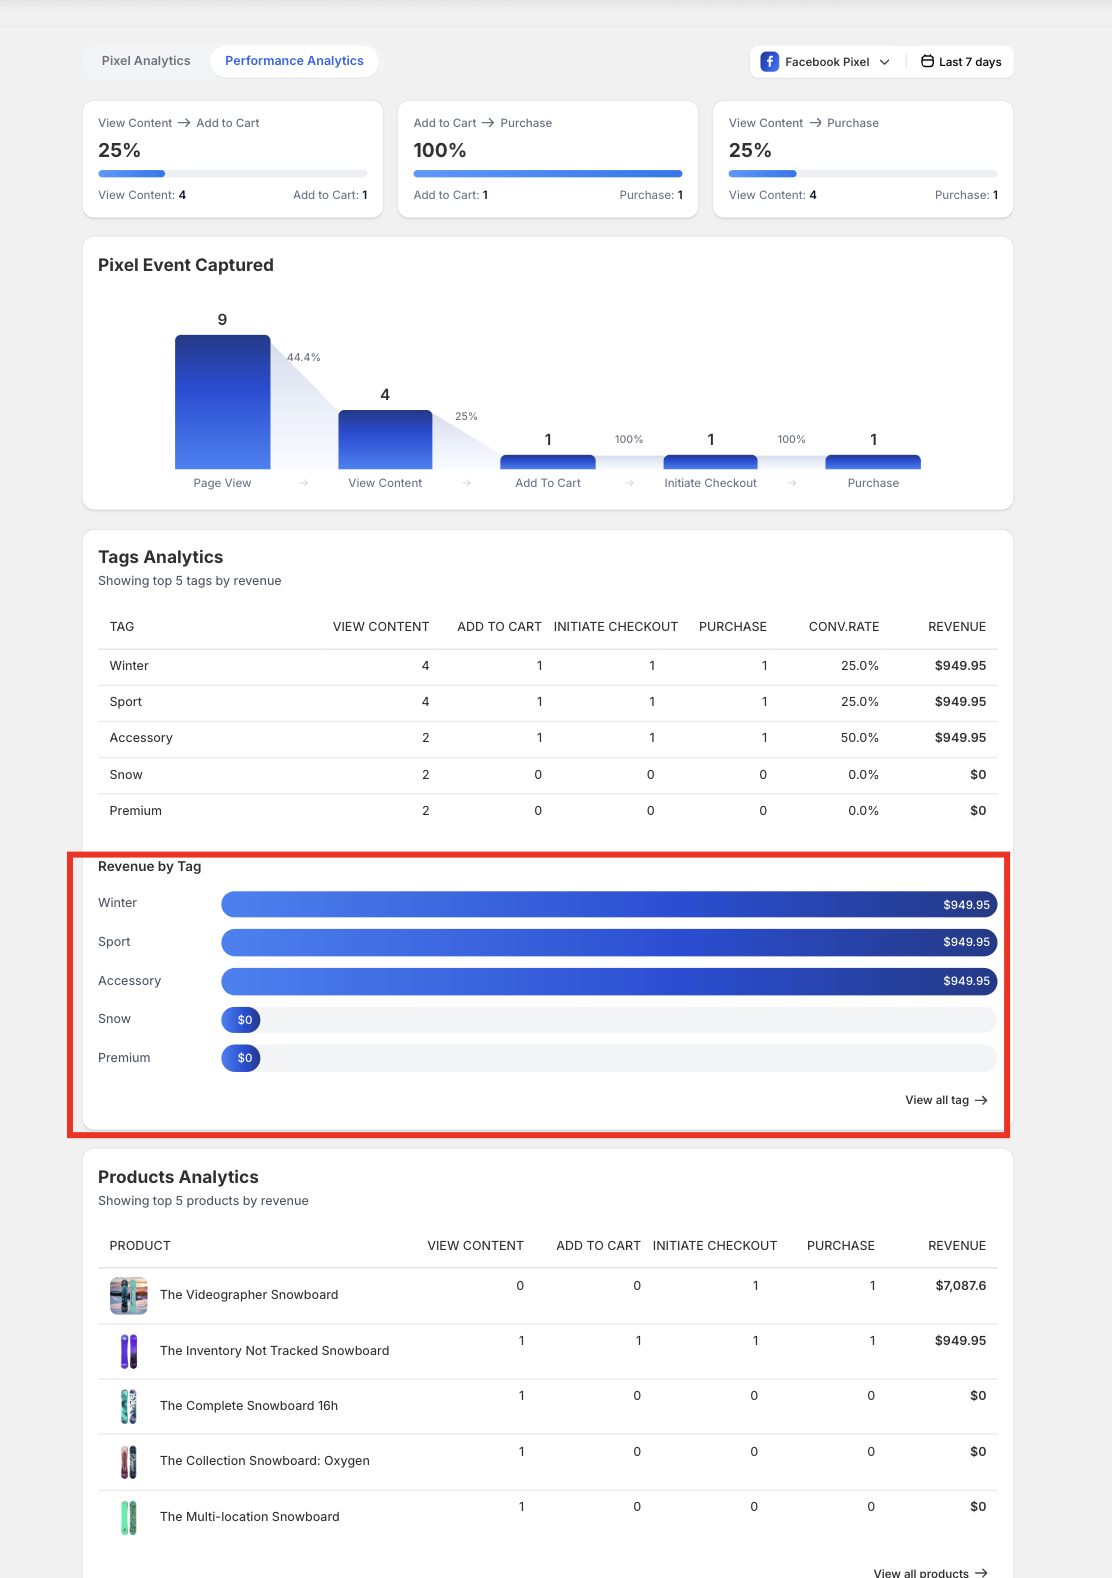
The Revenue by Tag chart helps identify which product categories generate the most sales.
Products Analytics
Displays the top performing products by revenue.
Metrics include:
View Content - Number of product page views for products with that tag.
Add to Cart - Number of times products with that tag were added to cart.
Initiate Checkout - Number of checkout events for products with that tag.
Purchase - Number of successful purchases.
Revenue: Total revenue generated by products.
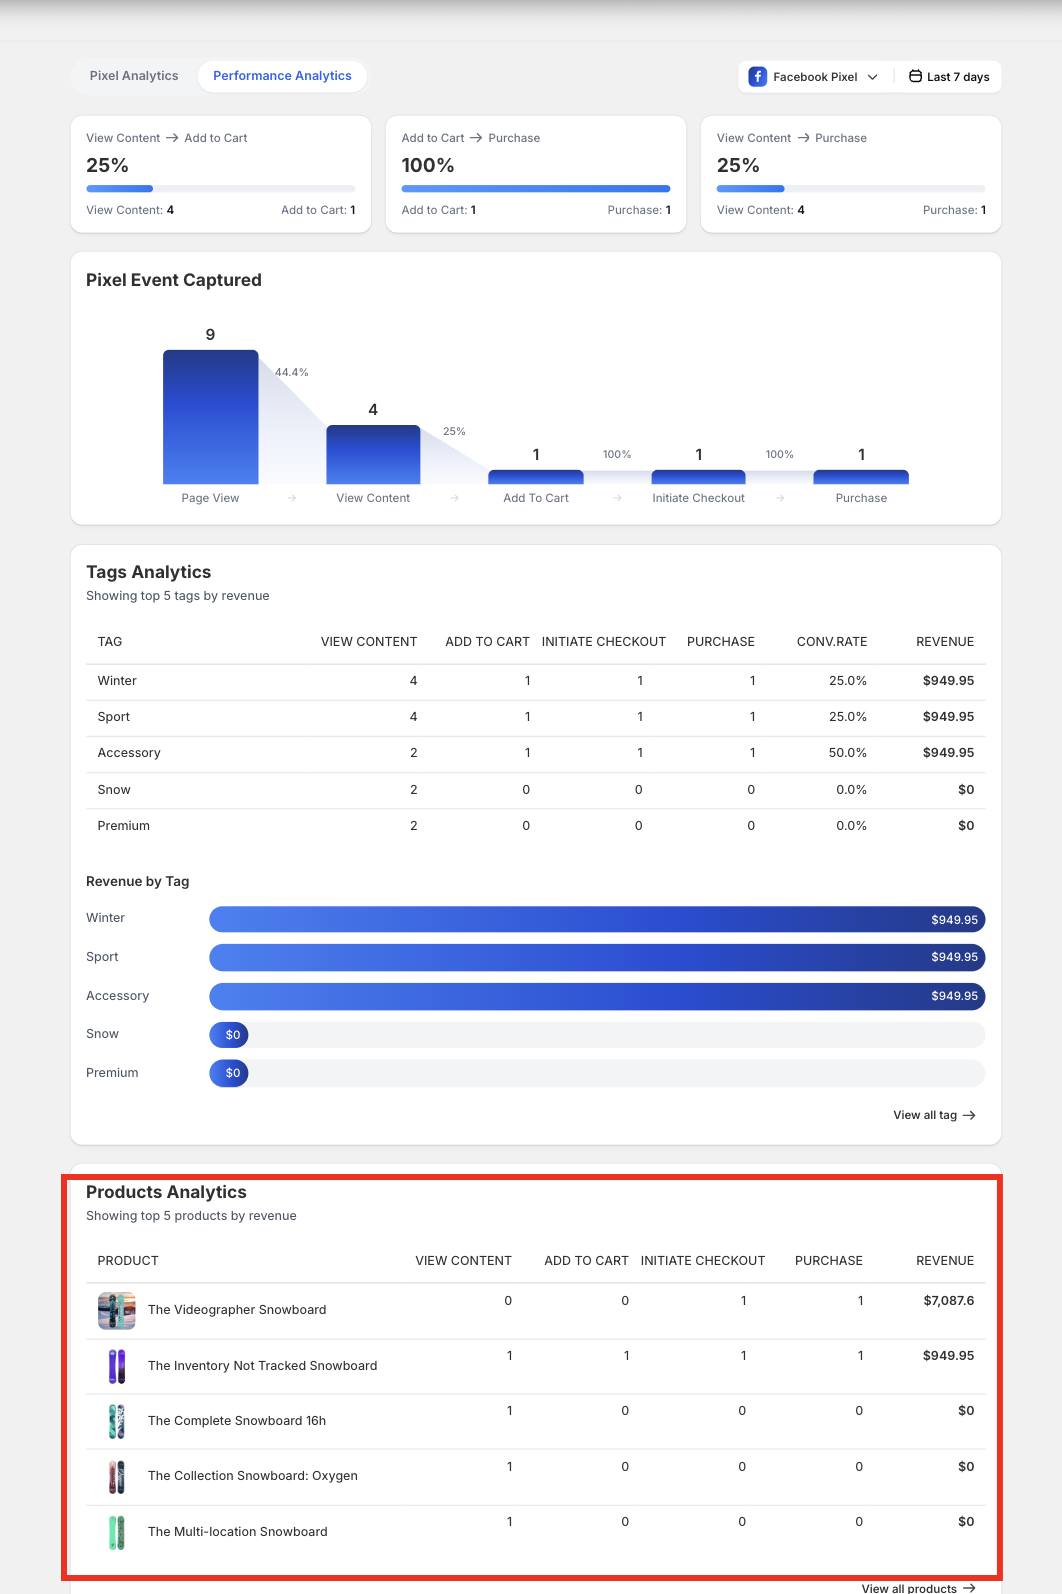
=> This section helps you identify best-selling products and high-interest items.
Still need help?
Our support team is available 24/7. Contact support →