

Pixel Analytics
Monitor your Facebook and TikTok Pixel performance with event metrics, trends, and conversion insights in one dashboard.
Overview
Pixel Analytics helps you monitor the performance of your connected Facebook and TikTok Pixels and understand how customers interact with your store.
From this guide, you will:
Switch between Facebook Pixel and TikTok Pixel.
Select a Pixel and date range for analysis.
View key event metrics and performance trends.
Analyze event activity over time.
Filter and explore specific event details.
How to Use Pixel Analytics?
Step 1: Open Pixel Analytics
Open the app in your Shopify Admin.
Go to Analytics.
Make sure the Pixel Analytics tab is selected.
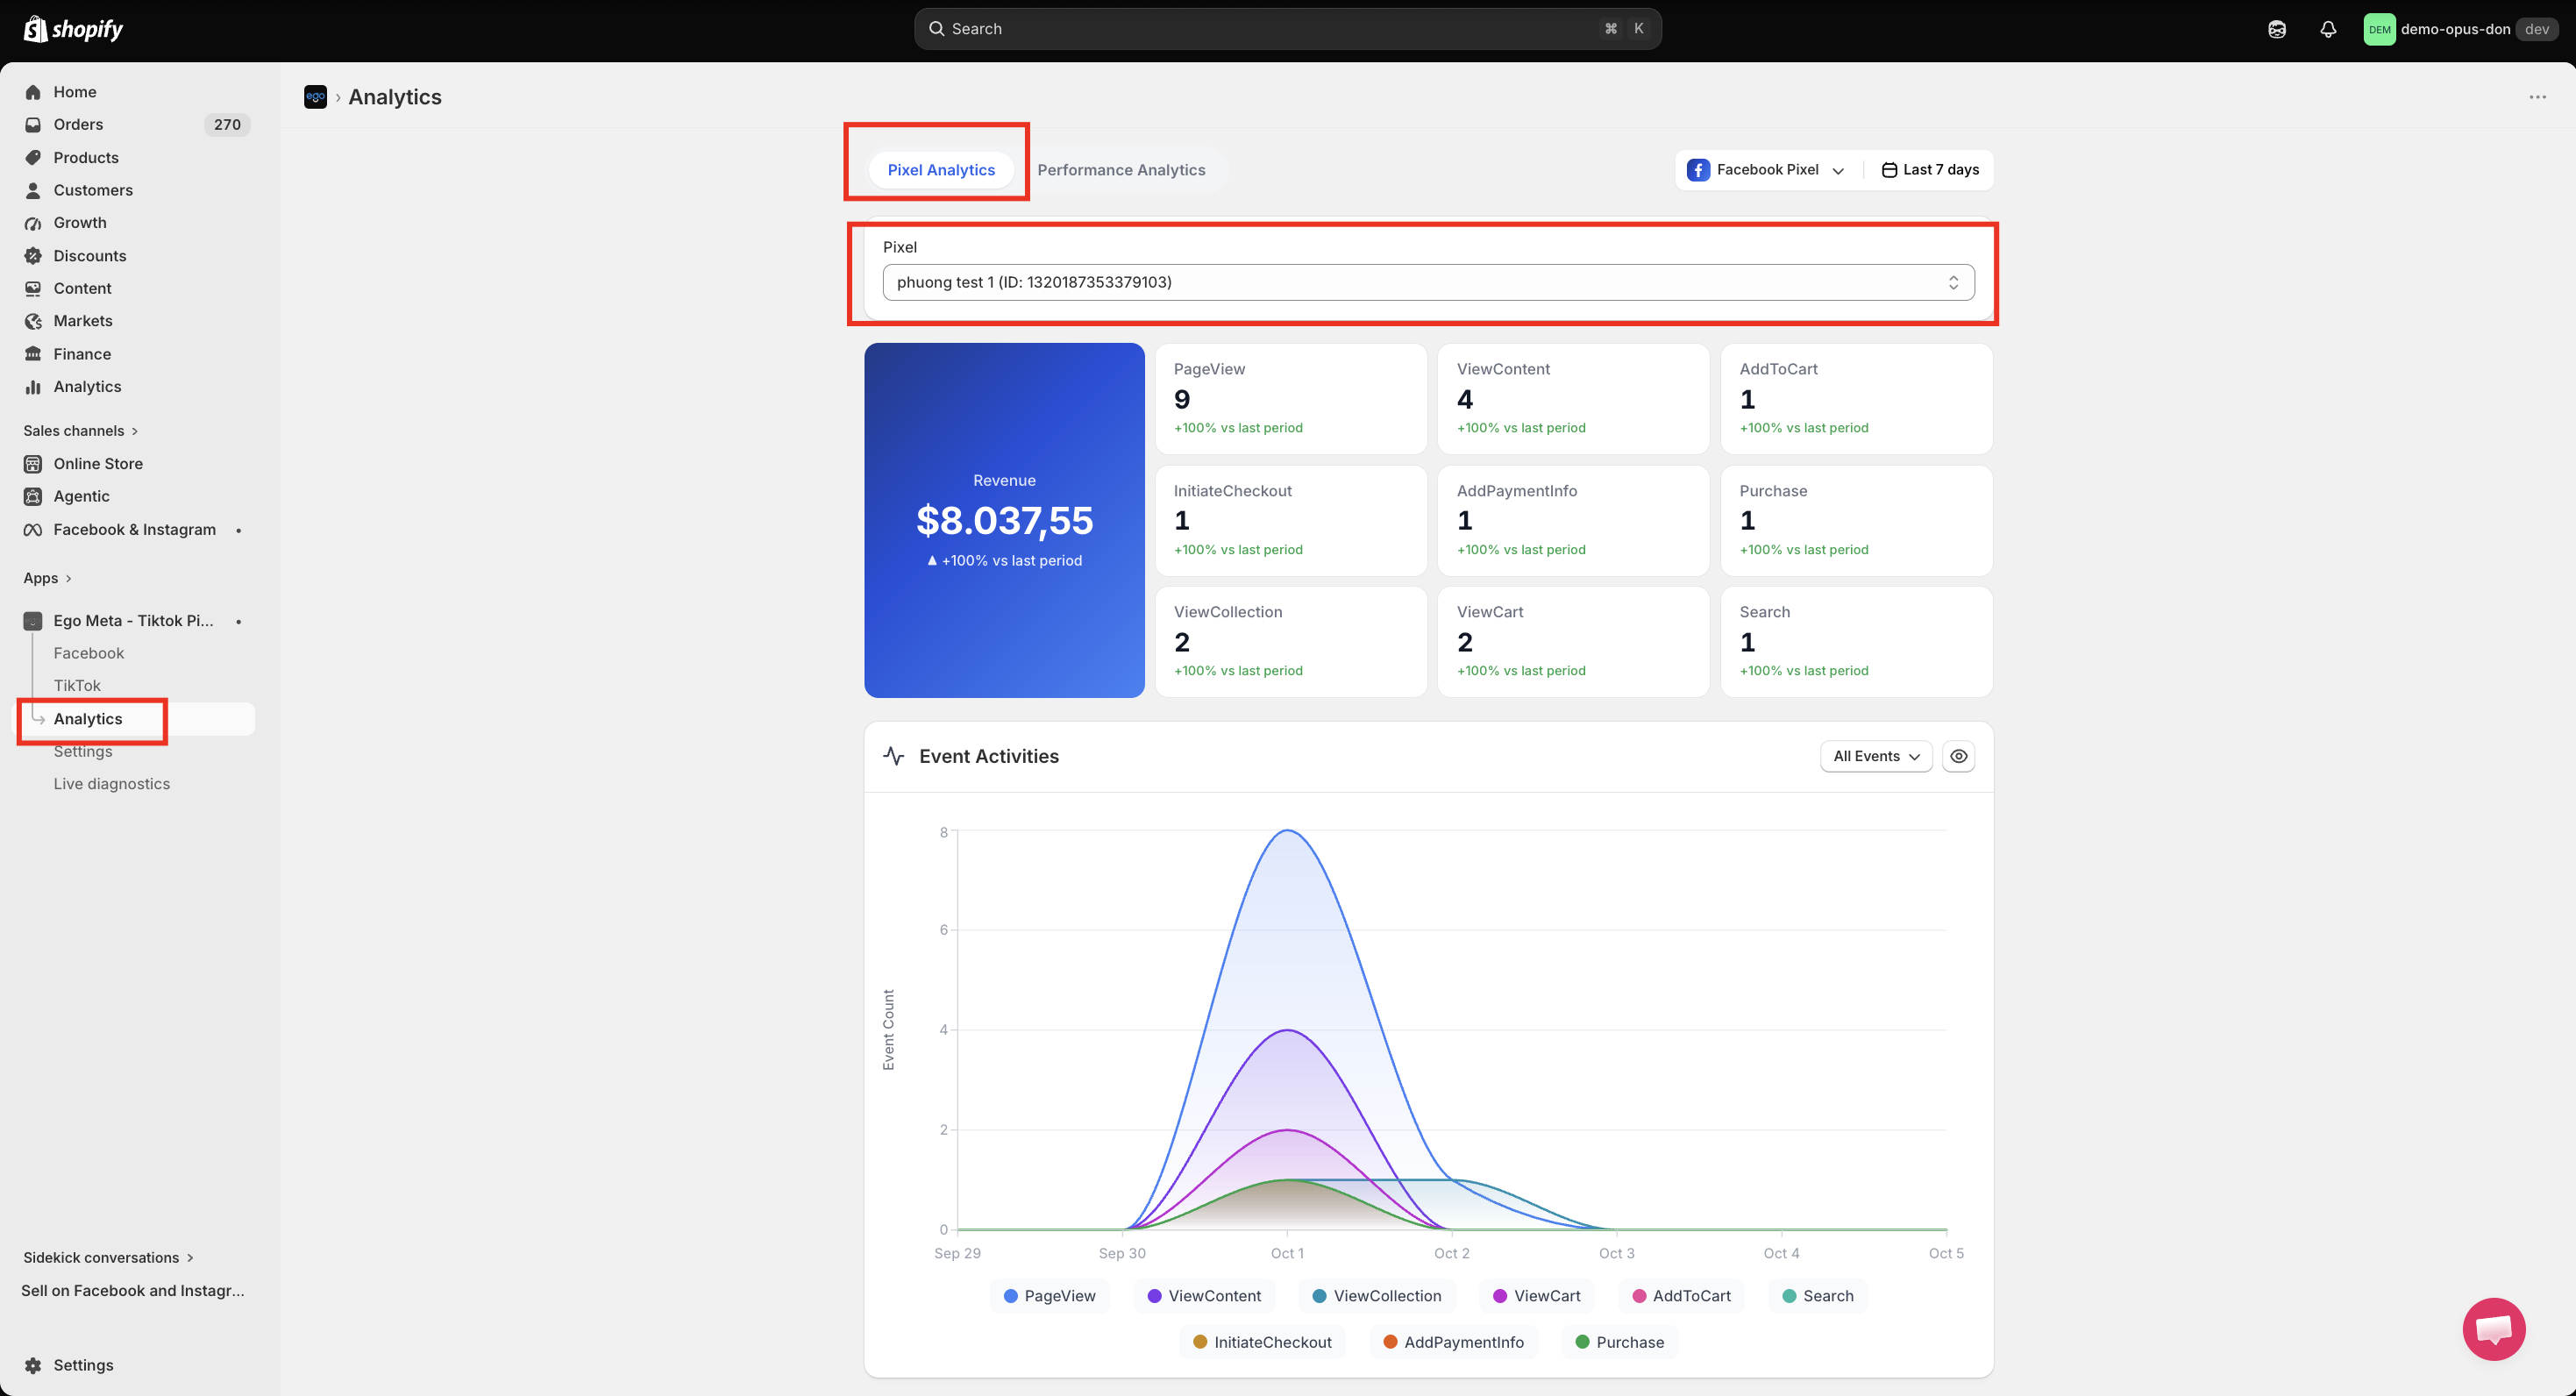
The dashboard will update automatically with the selected Pixel's data.
Step 2: Choose a platform
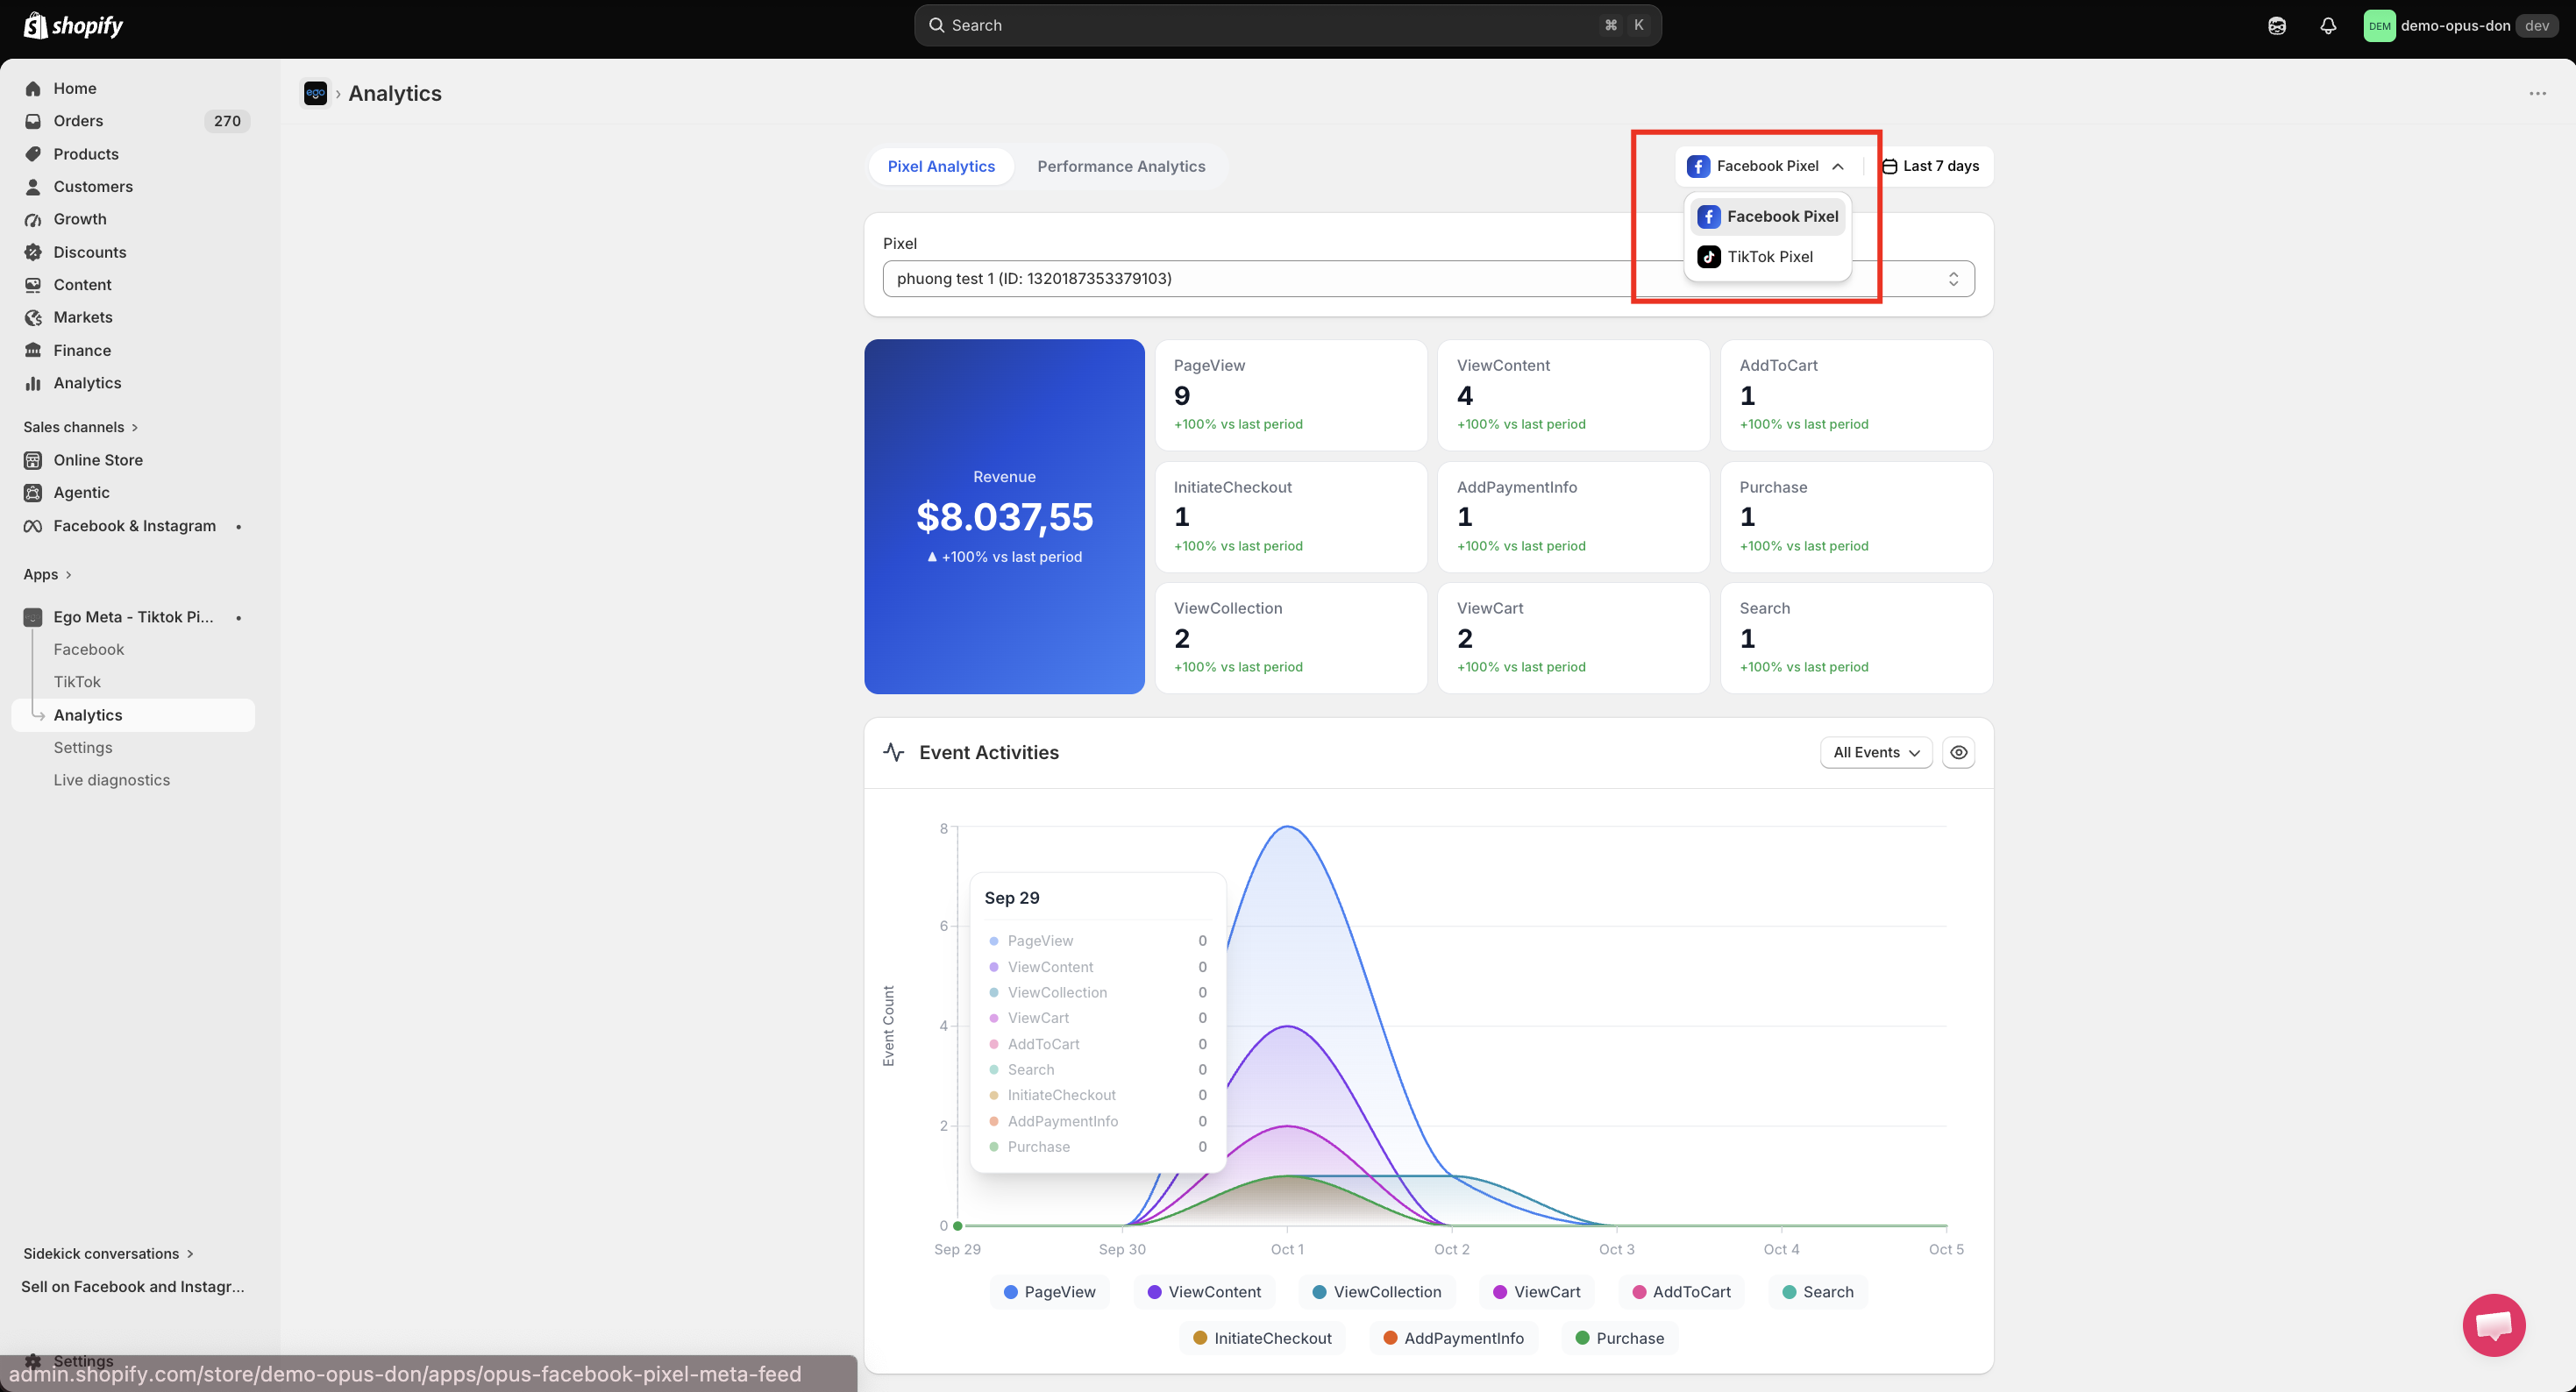
At the top right of the page, click the platform dropdown and select the platform you want to analyze:
Facebook Pixel: View analytics for your Meta (Facebook) Pixels.
TikTok Pixel: View analytics for your TikTok Pixels.
Step 3: Select a Pixel
Below the tabs, select the Pixel you want to analyze.
Click the Pixel dropdown
Choose the Pixel connected to your store (shown with its name and Pixel ID)
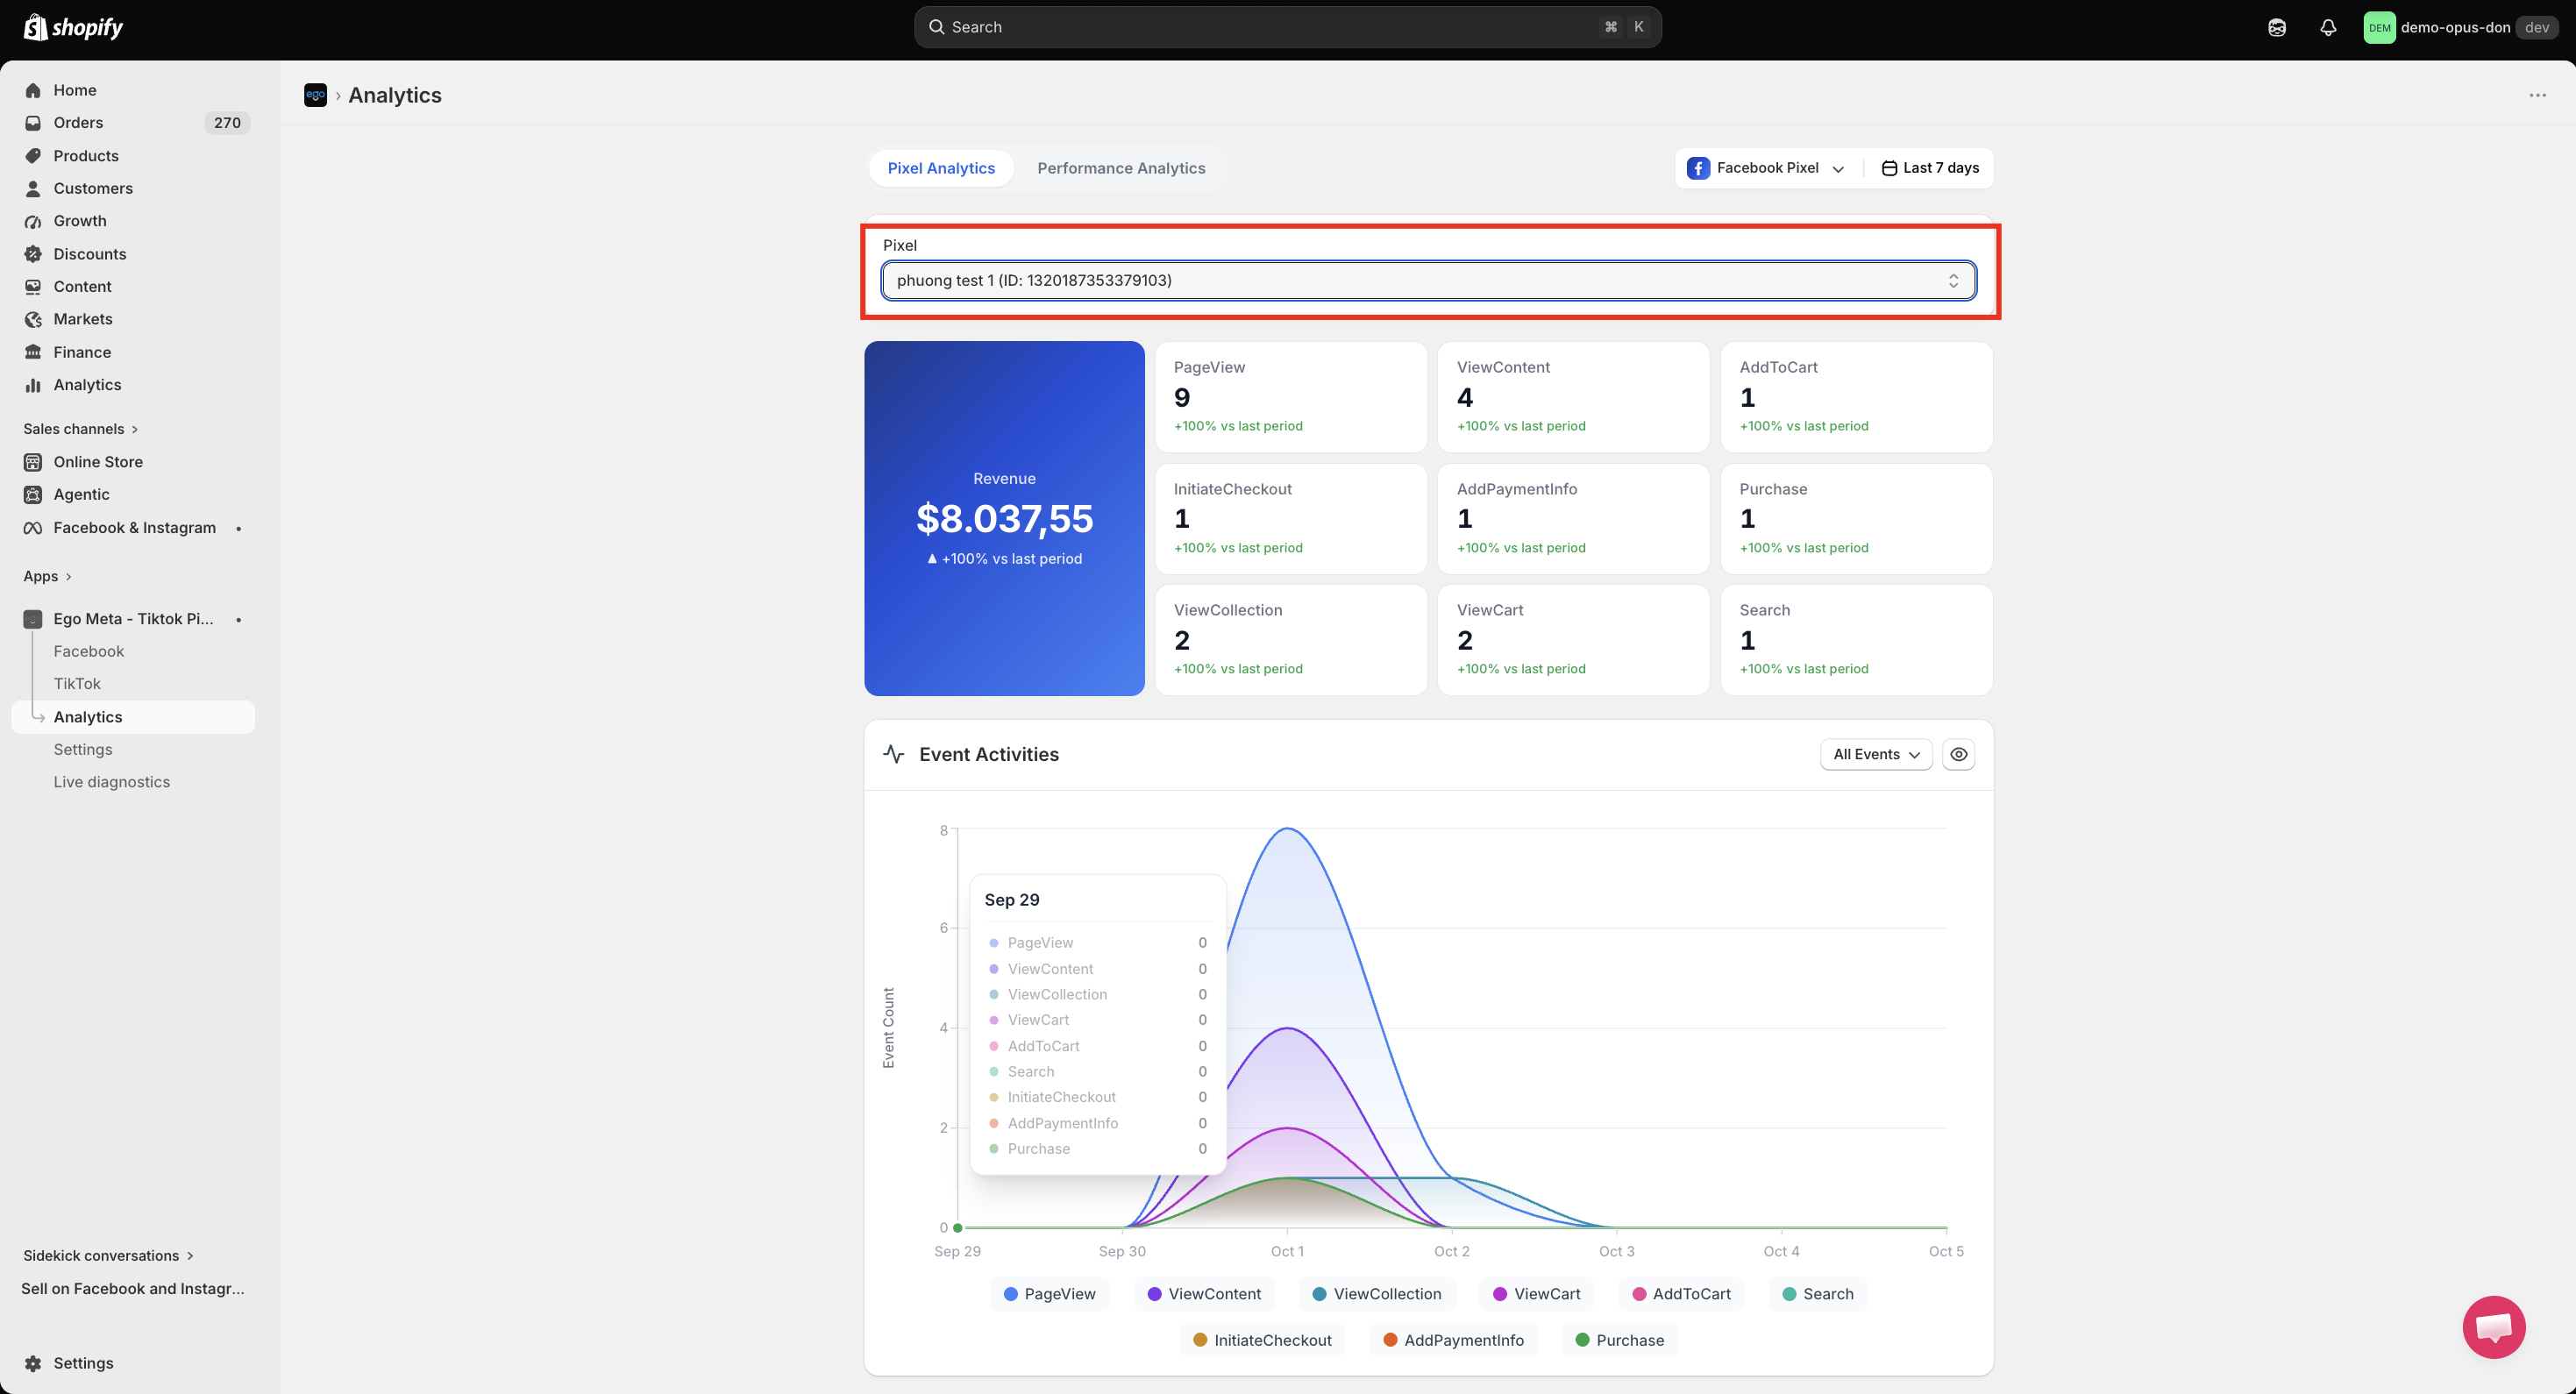
The dashboard will update automatically with the selected Pixel's data.
Note: Only Pixels of the selected platform are displayed. To see a TikTok Pixel, switch the platform to TikTok Pixel first.
=> The Pixel list and all data on the page will update based on the selected platform.
Step 2: Choose a Date Range
Use the Date Range filter to view analytics within a specific period.
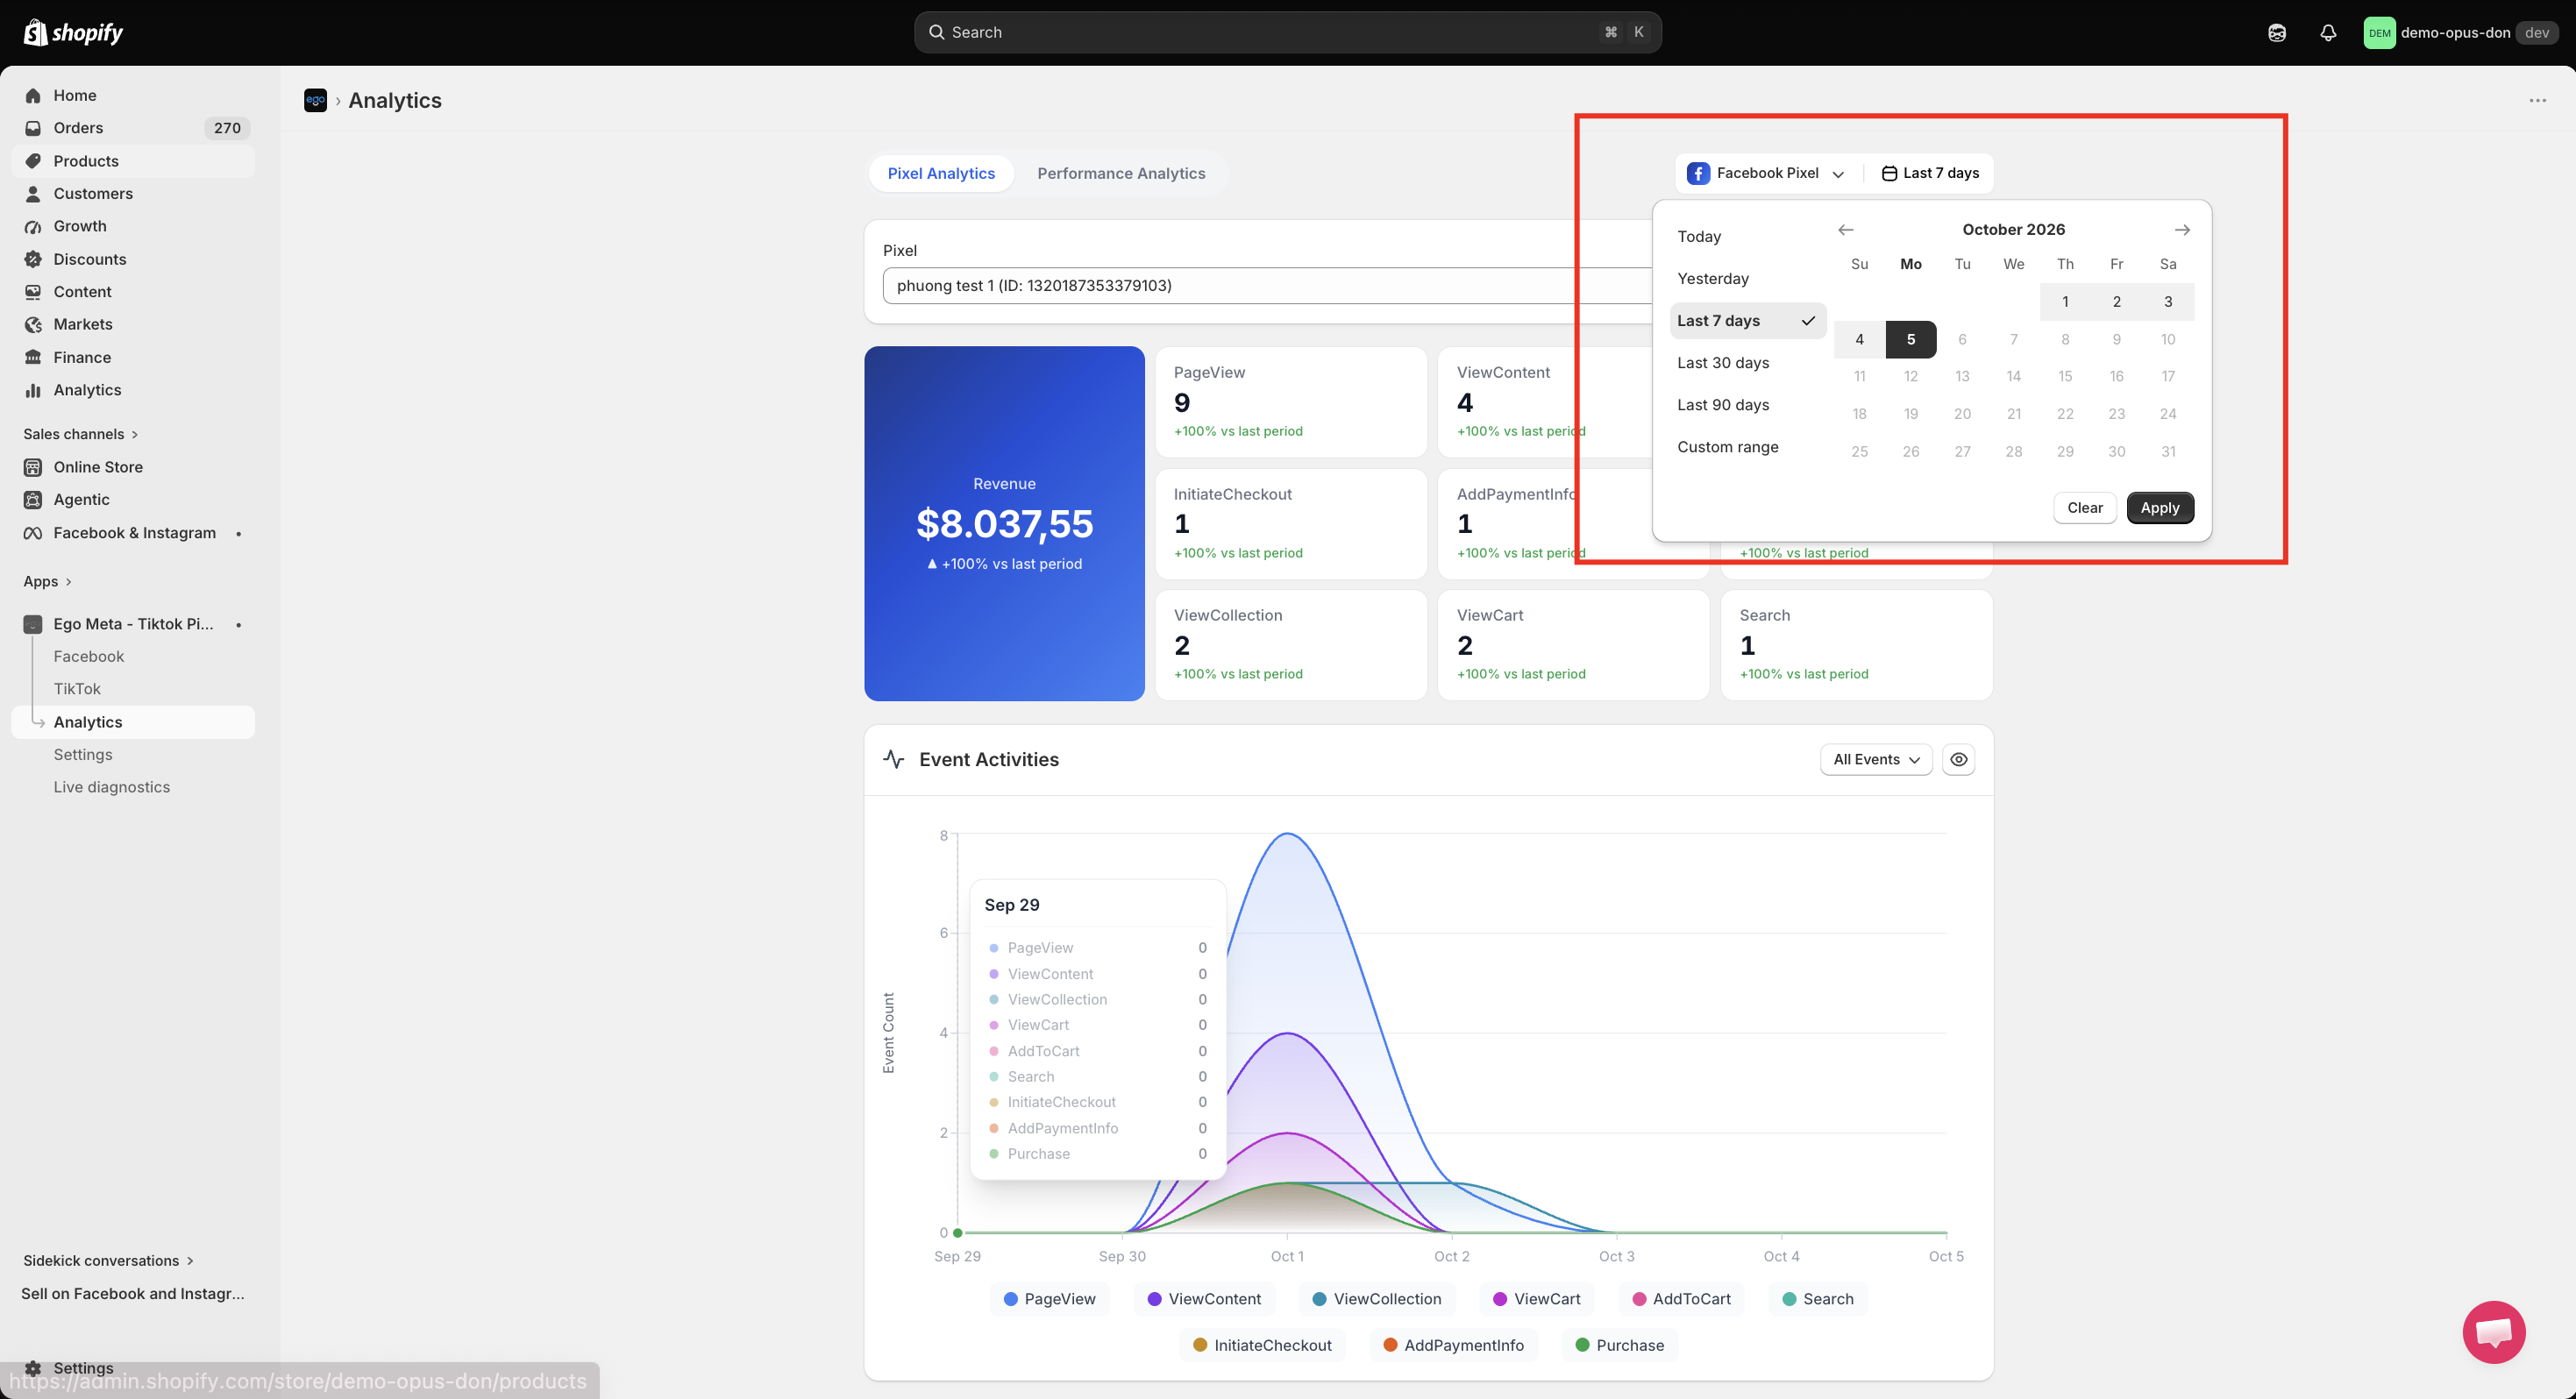
All metrics and charts will refresh based on the selected time range.
The dashboard displays key event statistics tracked by your Pixel.
Each card shows:
Total event count
Comparison with the previous period
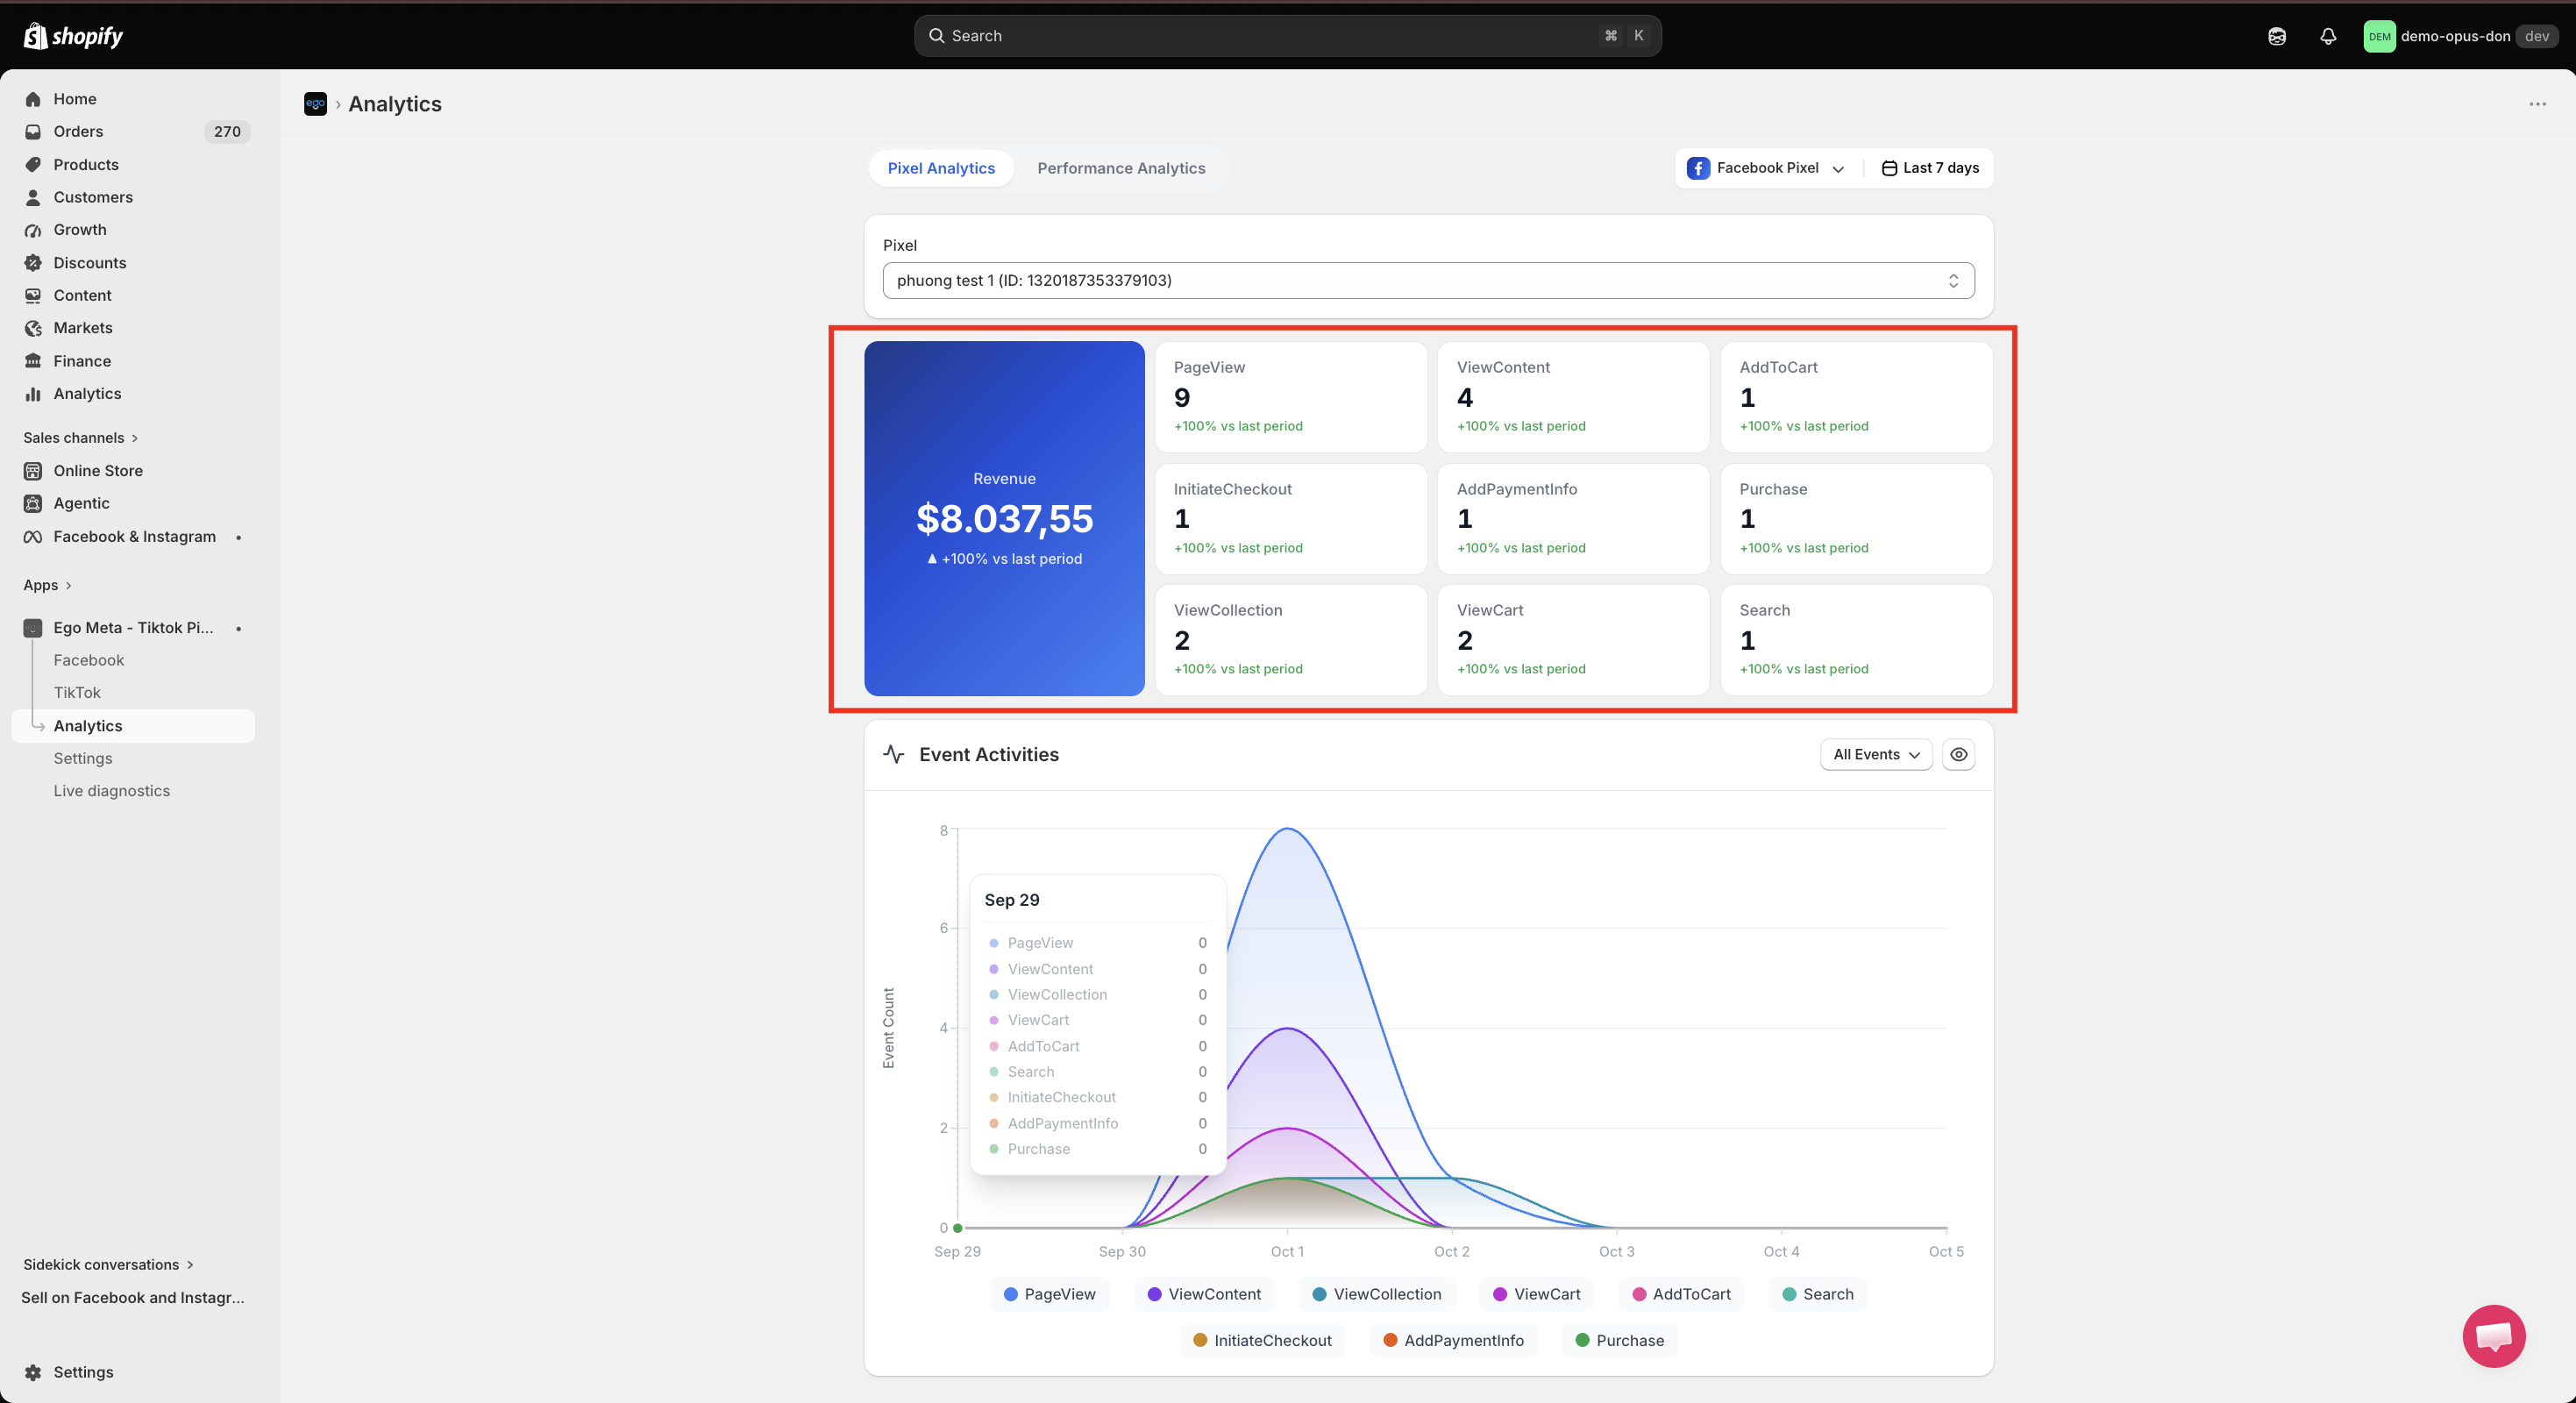
Event | Decription |
|---|---|
PageView | Triggered when a user visits a page on your store |
ViewContent | Triggered when a user views a product page |
ViewCollection | Triggered when a user views a product collection |
ViewCart | Triggered when a user views the shopping cart |
AddToCart | Triggered when a user adds a product to the cart |
Search | Triggered when a user performs a search |
InitiateCheckout | Triggered when a user starts the checkout process |
AddPaymentInfo | Triggered when a user enters payment information |
Purchase | Triggered when an order is successfully completed |
Revenue | Total revenue generated from purchase events |
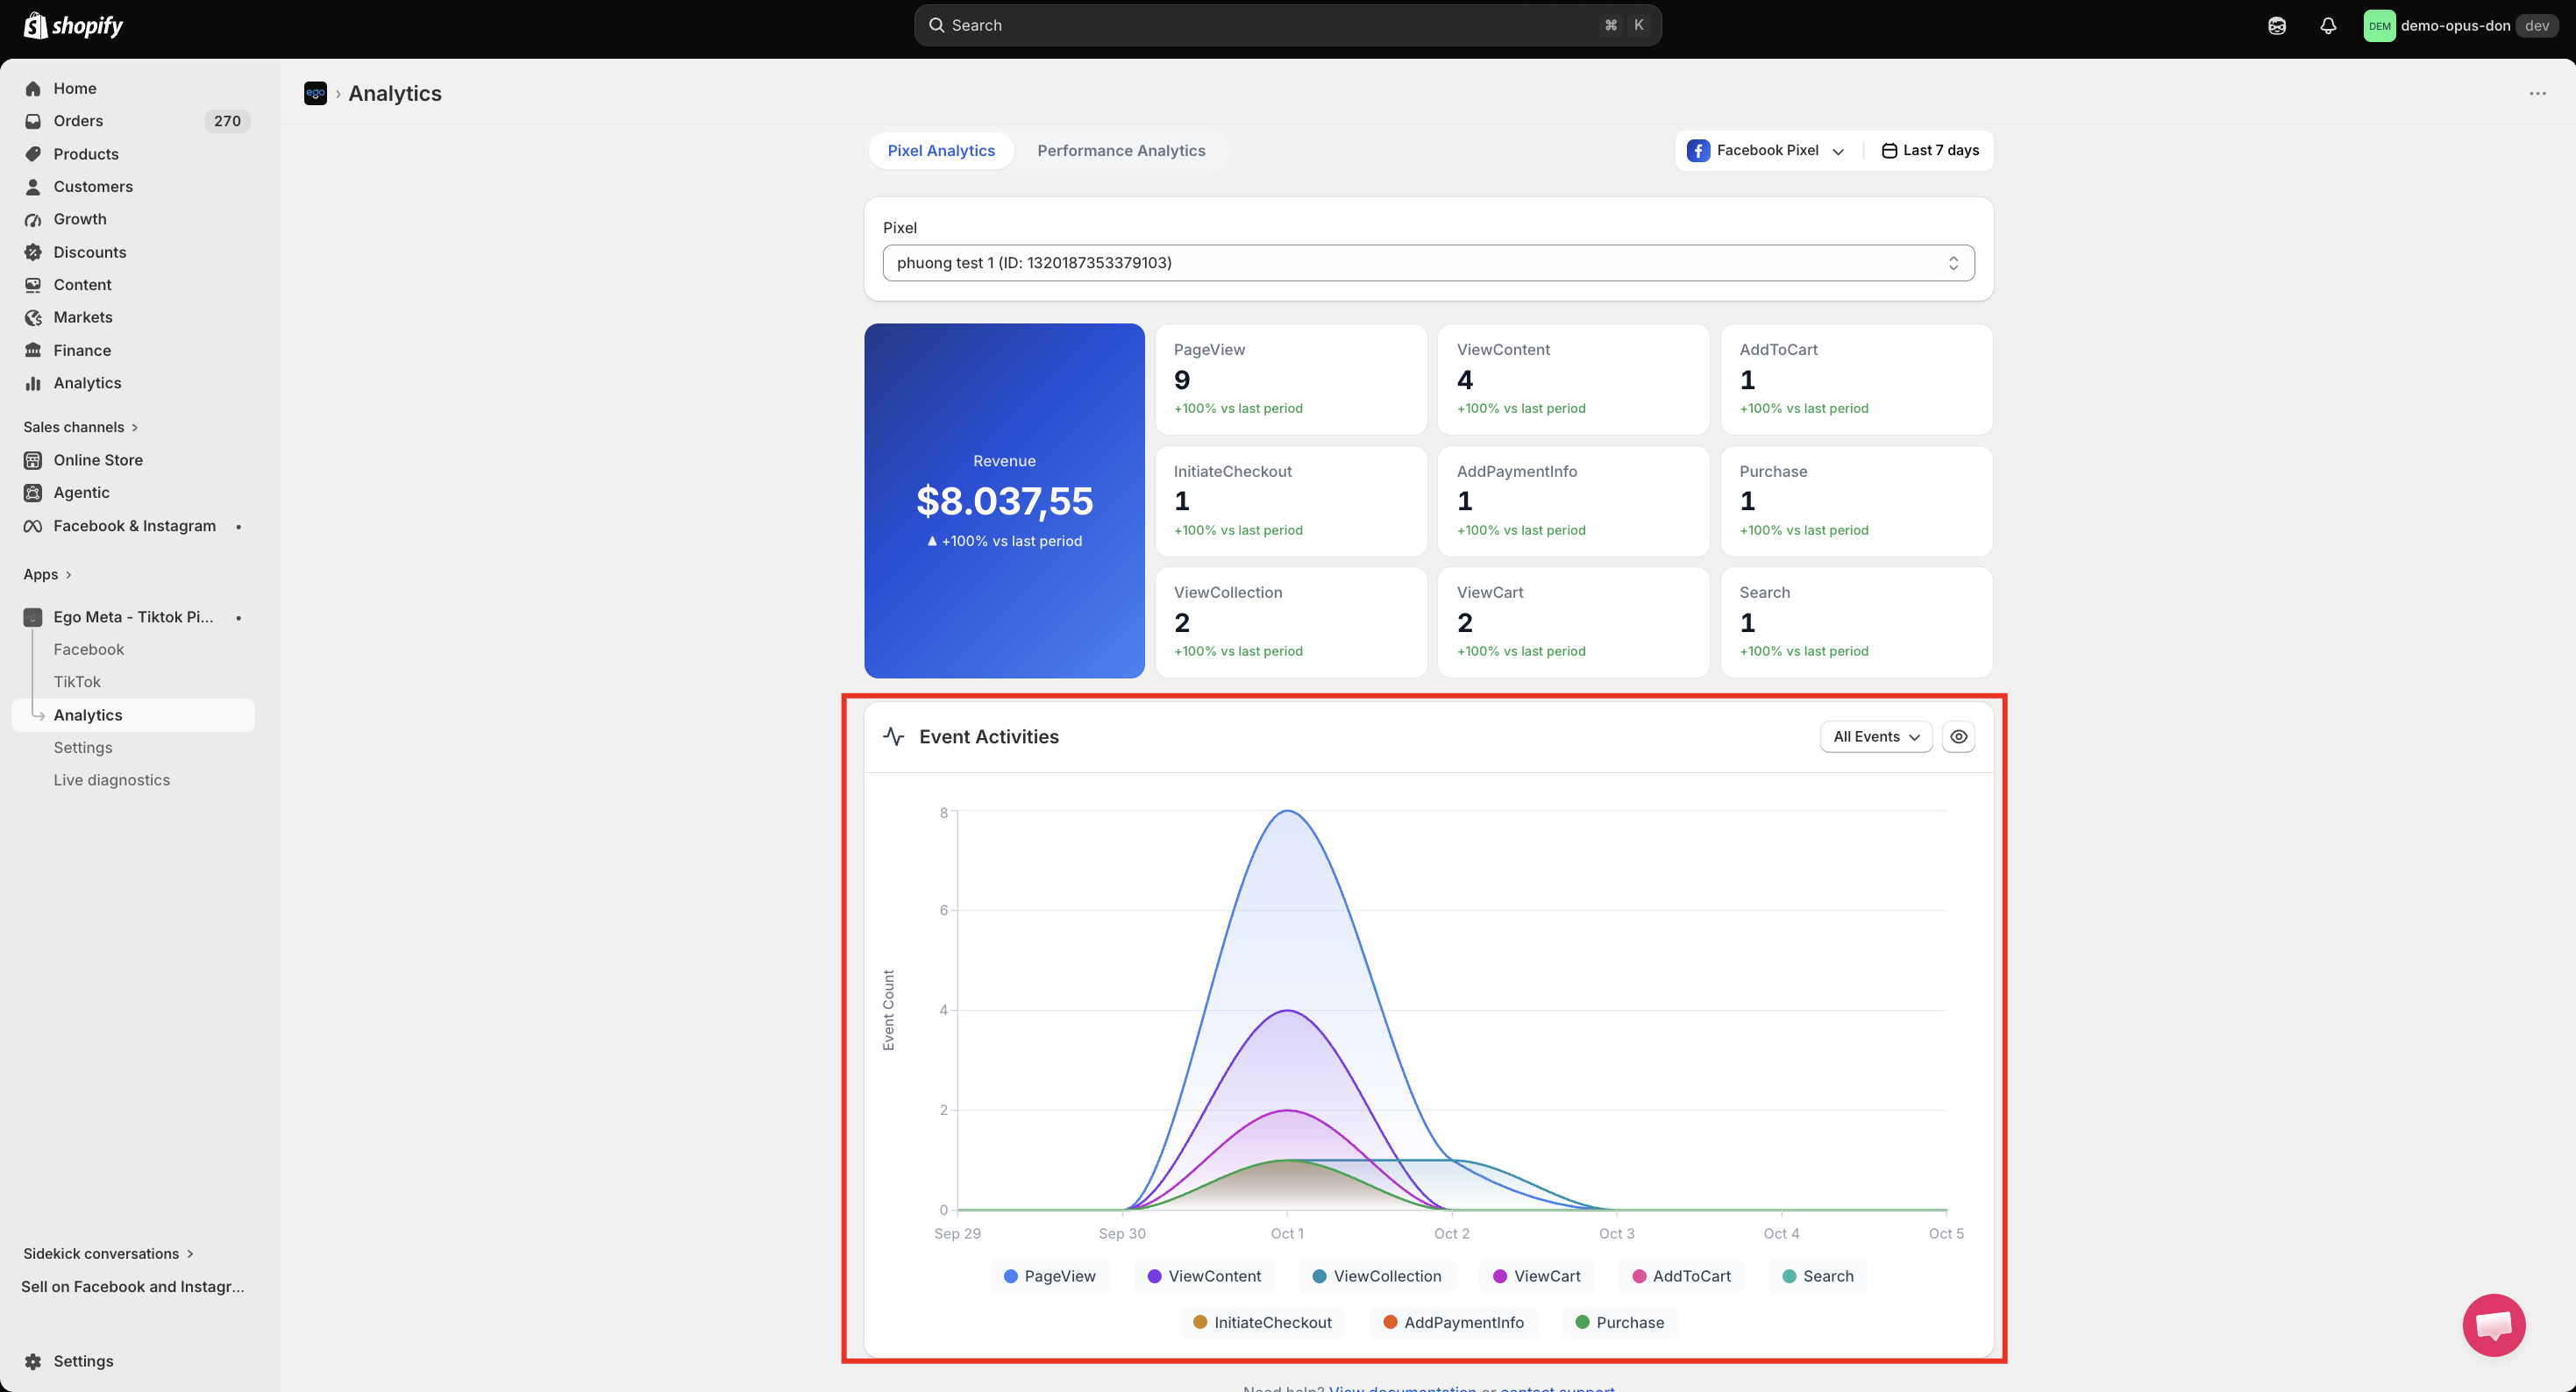
The Event Activities chart visualizes event activity over time:
Displays event trends across the selected date range
Each line represents a different event type
Helps identify traffic patterns and conversion behavior
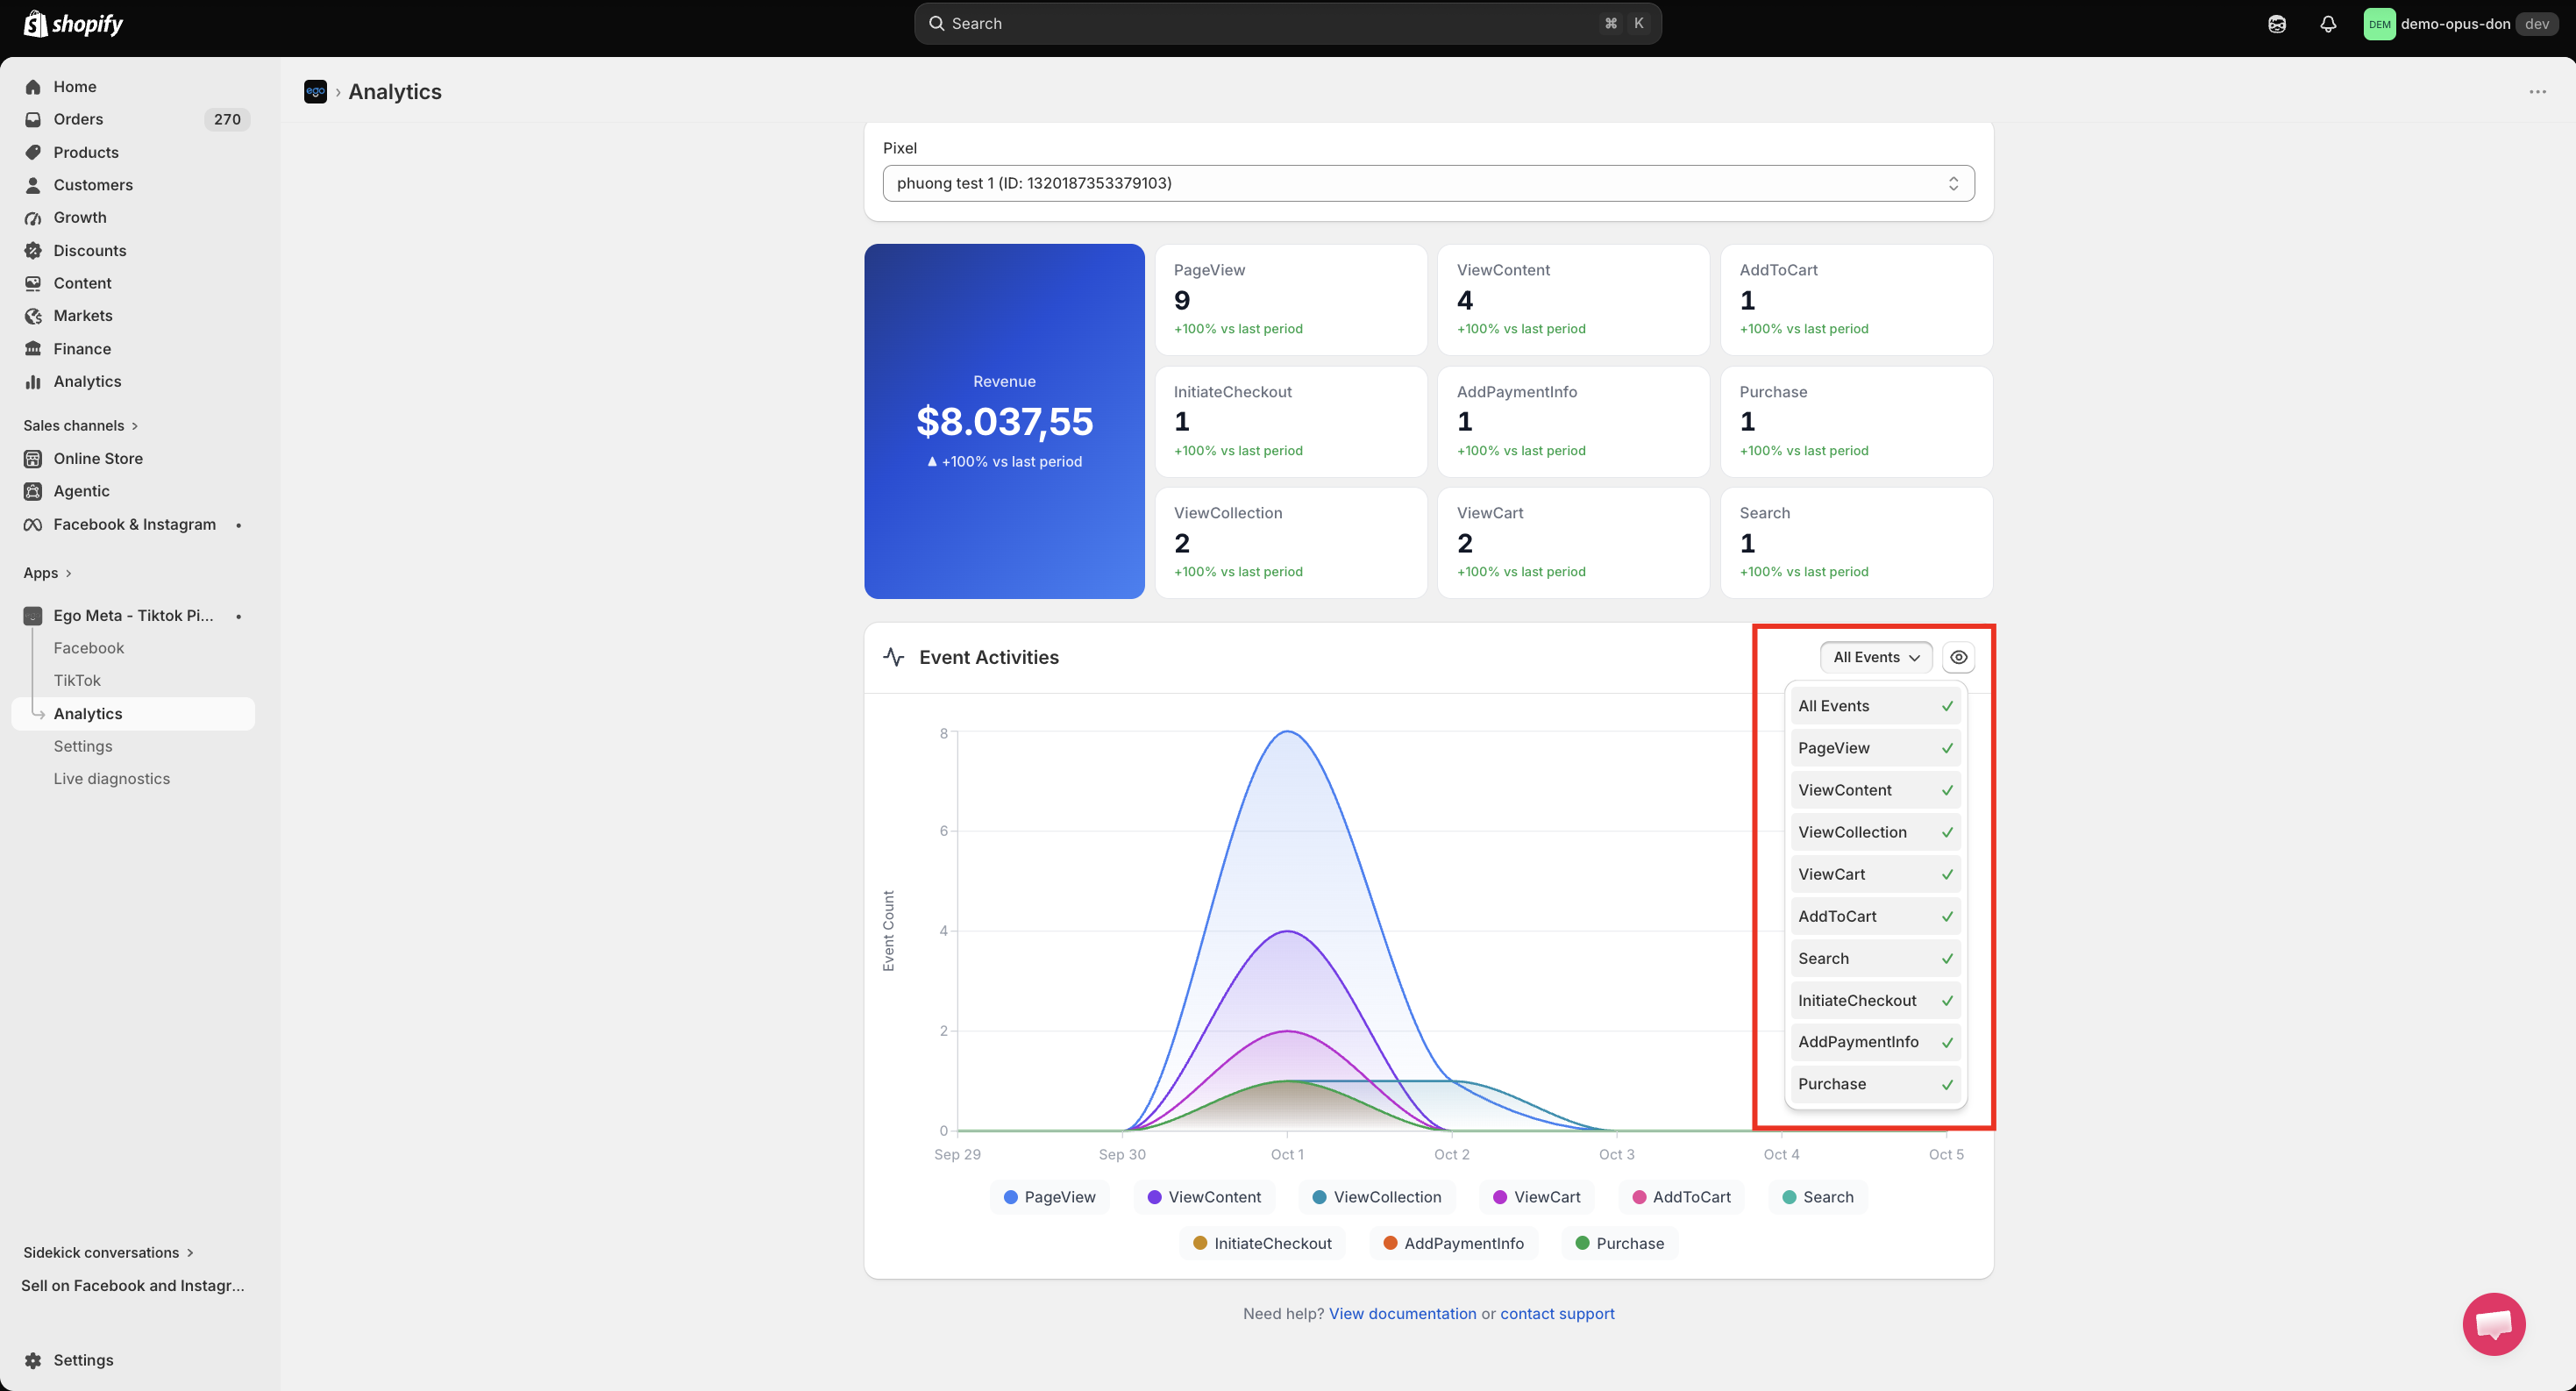
Action:
Use the All Events dropdown to filter specific event types.
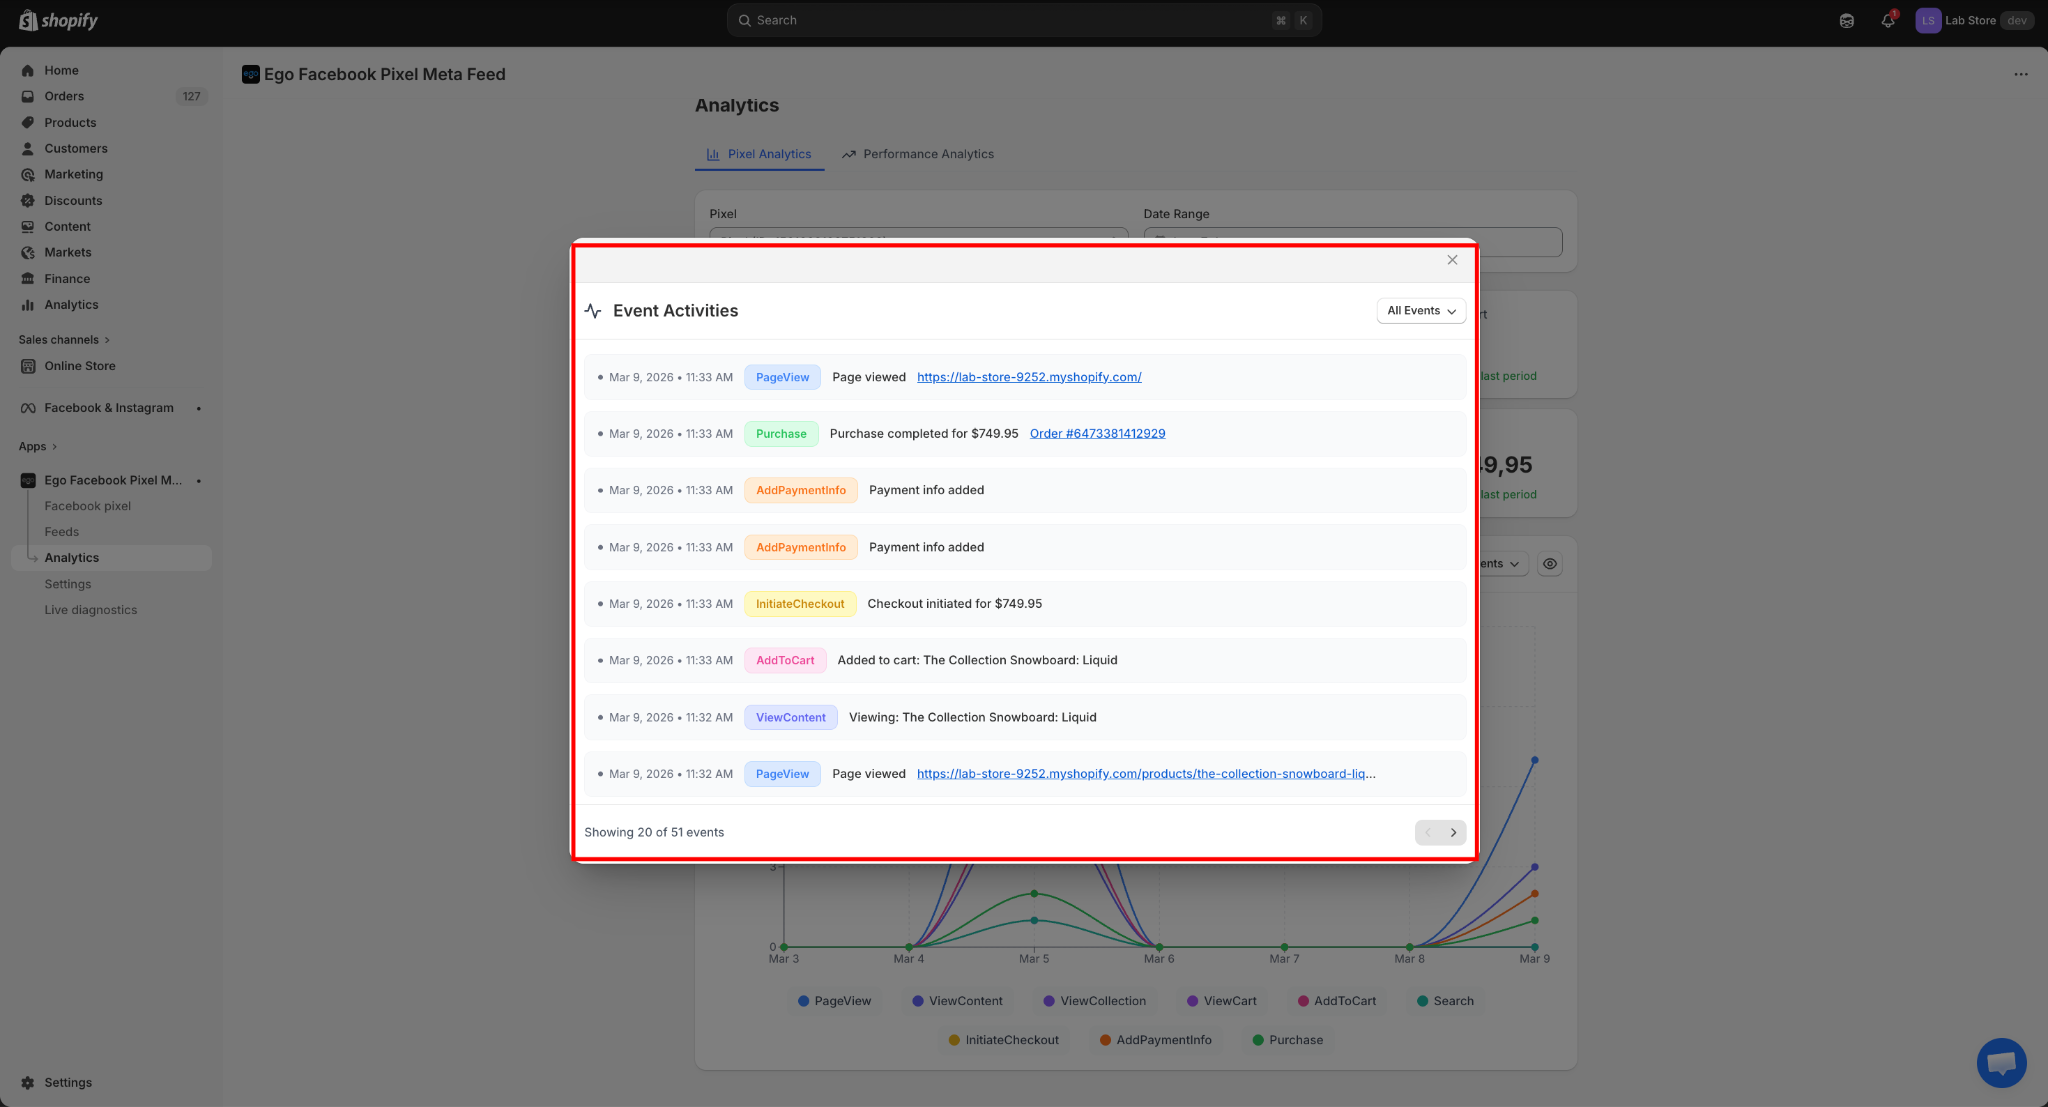
Click the icon "View" to display event details
Still need help?
Our support team is available 24/7. Contact support →